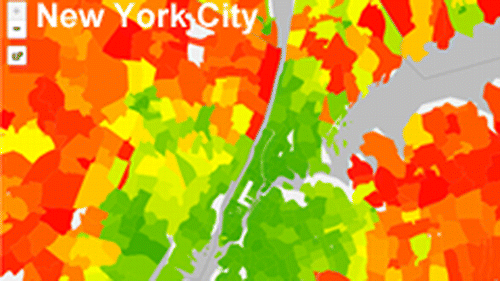
Many U.S. cities are taking steps to grow urban centers in an attempt to reduce greenhouse gas emissions. But a challenge is the significant carbon footprint of spacious suburban living, which in many areas, may be cancelling out these efforts. The report, appearing in the ACS journal Environmental Science & Technology, found that about half of the country's household carbon footprint comes from people living in the suburbs.
Christopher Jones and Daniel M. Kammen point out that U.S. households, though they only comprise 4.3 percent of the global population, are responsible for about 20 percent of annual worldwide greenhouse gas emissions, which are driving climate change. In response, many governors and mayors across the country have pledged to reduce their states' and cities' emissions. But more information on the size and composition of household carbon footprints is needed to inform policies to make these reductions happen. A few studies have helped fill in some gaps, but they're mostly small in scale and not broadly applicable. Jones and Kammen set out to paint a bigger picture.
They built an analytic model using national survey data to estimate average household carbon footprints for over 30,000 zip codes and 10,000 cities and towns in all 50 U.S. states. Their technique integrates a wide range of sectors, including transportation, household energy use and consumption of food, goods and services. The researchers found a number of surprising nuances. For example, Jones and Kammen found that population-dense suburbs have significantly higher carbon footprints on average than lower density suburbs, and there is a huge range across cities. As a result, they conclude that "an entirely new approach of highly tailored, community-scale carbon management is urgently needed."
They have developed communication and estimation tools for public use at http://coolclimate.berkeley.edu/maps and http://coolclimate.berkeley.edu/carboncalculator.
More information: "Spatial Distribution of U.S. Household Carbon Footprints Reveals Suburbanization Undermines Greenhouse Gas Benefits of Urban Population Density" Environ. Sci. Technol., 2014, 48 (2), pp 895–902. DOI: 10.1021/es4034364
Abstract
Which municipalities and locations within the United States contribute the most to household greenhouse gas emissions, and what is the effect of population density and suburbanization on emissions? Using national household surveys, we developed econometric models of demand for energy, transportation, food, goods, and services that were used to derive average household carbon footprints (HCF) for U.S. zip codes, cities, counties, and metropolitan areas. We find consistently lower HCF in urban core cities (40 tCO2e) and higher carbon footprints in outlying suburbs (50 tCO2e), with a range from 25 to >80 tCO2e in the 50 largest metropolitan areas. Population density exhibits a weak but positive correlation with HCF until a density threshold is met, after which range, mean, and standard deviation of HCF decline. While population density contributes to relatively low HCF in the central cities of large metropolitan areas, the more extensive suburbanization in these regions contributes to an overall net increase in HCF compared to smaller metropolitan areas. Suburbs alone account for 50% of total U.S. HCF. Differences in the size, composition, and location of household carbon footprints suggest the need for tailoring of greenhouse gas mitigation efforts to different populations.
Journal information: Environmental Science & Technology
Provided by American Chemical Society


