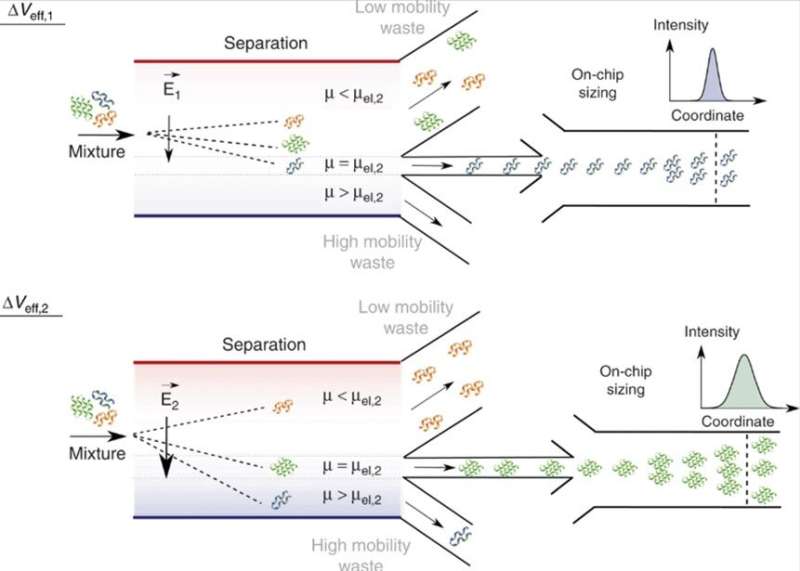
On-chip separation and analysis of mixtures in liquid phase. By adjusting the effective voltage, ΔVeff, molecules of a specific electrophoretic mobility, μ = μel, and hence of a specific charge to hydrodynamic radius ratio, qRh, can be directed to the analysis area with those of smaller (μ < μel) and larger (μ > μel) mobility values directed to the waste collection channels. As the applied voltage can be varied, only a single analysis unit is required and the width of the separation chamber can be kept constrained, allowing the device to retain a high voltage efficiency and a fast processing speed. In the analysis area, the fractions are sized through microfluidic diffusional sizing (MDS) by monitoring their spatiotemporal motion under laminar flow conditions. Credit: Microsystems & Nanoengineering, doi: 10.1038/s41378-019-0072-3
Microfluidic systems are used in molecular biology, biochemistry and biotechnology to rapidly analyze heterogenous biomolecular mixtures with high recovery rates and minute sample volumes. However, it is challenging to combine preparative and analytical processes within a single device for fast integrated analysis. In a recent study now published on Microsystems and Nanoengineering, Kadi L. Saar and co-workers at the interdisciplinary departments of chemistry, physics, and Fluidic Analytics Limited in Cambridge, U.K., have developed a chip combining the two steps of preparation and analysis.
Initially, they used voltage to separate protein molecules within a binary mixture of equally sized biomolecules indiscernible via conventional sizing or resolving techniques. Thereafter, the research team used the new device to obtain a 2-D fingerprint of a heterogenous protein mixture. The results will open new possibilities to acquire rapid multiparameter data on biomolecular systems on a short time-scale.
Microfluidics techniques are attractive to analyze biological samples due to very low sample requirements and a high recovery rate. The platforms can provide unsurpassable analysis speed at the level of individual units of operation or provide several units with directly combined workflow, without sample transfer between the units. Such transfers occur through connectors or tubes and introduce dispersion to the sample, affecting the system's performance. The workflow proposed herein can separate heterogenous mixtures to determine the components of interest and reduce complexities for further processing of the mixture for its purification.
Researchers had previously introduced a variety of continuous flow-based molecular separation strategies at the micron scale, including free-flow electrophoresis, dielectrophoresis, magnetophoresis and acoustophoretic separation. Detection strategies such as laser- or LED-induced fluorescence (LIF), chemiluminescence or electrochemical approaches can be ingrained in parallel within such microfluidic separation platforms. Analytical information on the separated compounds can be achieved with offline strategies such as mass spectroscopy or SDS-PAGE, but the techniques can limit the processing speed in a single device, causing sample loss or contamination.
Saar et al. therefore developed fully integrated separation and quantitative characterization of heterogenous biomolecular samples in a single microfluidic device to overcome the existing limits by directly coupling on-chip separation to on-chip analysis and molecular sizing. The design feature permitted the analysis of a specific fraction by adjusting the applied field strength. They designed the device to identify separated fractions similar to SEC-MALS (size-exclusion chromatography with multi angle light scattering) or LC (chip)-MS ((on-chip)-liquid chromatography-mass-spectrometry) methods.
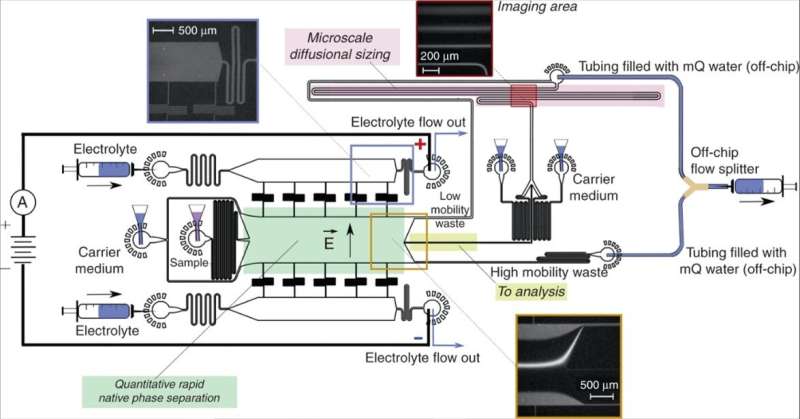
Device design and operation. A free-flow electrophoresis unit (green), allowing rapid separation of analyte molecules in their native phase and yielding quantitative information on the separation process, directed fractions of the sample (yellow) to a downstream analysis process involving microfluidic diffusional sizing (MDS; pink). The sample was characterized by monitoring a single imaging frame (top right inset) to simultaneously extract the sizes and the charges of the separated fractions. The device was operated by applying a negative pressure at its outlet with a Y-shaped off-chip flow splitter keeping the solutions from the “low mobility waste” and “high mobility waste” channels separated to avoid partial short circuiting of the device. The electric potential was applied from the electrolyte solution outlets employing a flowing electrolyte solution as described previously13. The flow of the electrolyte solution, which included a fluorescent tracer for its visualization, was chosen such that the electrolyte would reach its outlet rather than be withdrawn into the separation chamber without reaching it (top left inset), yet it would leak into the chamber by a controlled distance, leaving sufficient space for deflecting the sample beam (bottom inset). Credit: Microsystems & Nanoengineering, doi: 10.1038/s41378-019-0072-3
The device had the additional benefit of performing the entire process fully ingrained for electrophoretic separation in free solution, allowing researchers to obtain a quantitative map in a few minutes—much faster than conventional techniques. The mixture was unaffected by the supporting medium, and the researchers could study both weak and non-covalent molecular interactions.
Saar et al. designed the device using a native phase quantitative electrophoresis unit connected to a microfluidic diffusional device sizing (MDS) unit. The combined platform allowed components of specific electrophoretic mobility (µe1) for on-chip downstream analysis, as a function of the applied electric field strength. They designed three channels downstream of the electrophoresis unit to maintain products of electrolysis away from the chip without entering the device. They minimized the number of individual units that drove the flow in the device, coupled to stable device operation for quantitative sample characterization. The scientists kept the outlets of the electrolyte separate from the combined device to apply electric potential across the device without generating an electrical short-circuit, and to allow the efficient removal of any electrolysis product without accumulation to prevent pressure fluctuations.
The research team applied the electric potential on metallic connectors to generate a metal and fluid interface outside the chip in accordance with the device prototype designed by the same team. In this work, Saar et al. designed a Y-shaped flow splitter and kept the streams apart until they reached the splitter to prevent partial short circuiting. They calculated the flow rate of the electrolyte into the device to have an effect on device performance.
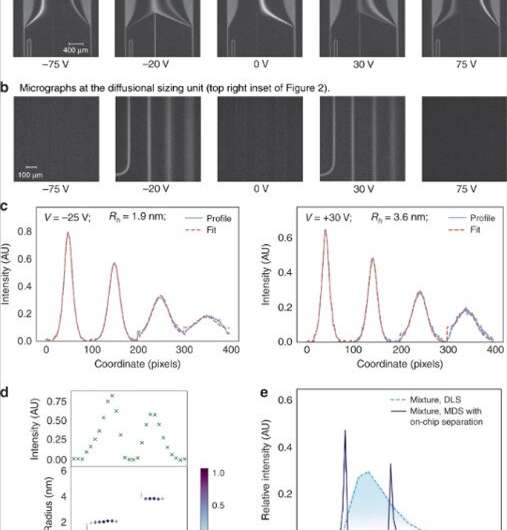
(a) The voltage applied across the electrophoresis chamber was adjusted in linear steps to direct specific fractions to analysis. (b) The fractions were then sized by imaging the diffusional sizing unit consisting of four channels in which the extent of the diffusion of the analyte molecules into their surrounding carrier buffer was monitored. (c) The average size of the analytes molecules in each of the fractions were found by fitting the observed fluorescent profiles for different hydrodynamic radii (Rh) and minimizing the least mean square error between the fit (red dotted line) and the data (blue continuous line). (d) The fluorescence intensity in the analysis area varied depending on the concentration of the analytes in each of the fractions (top) and the sizes of the components in a binary mixture of lysozyme and bovine serum albumin were found to be Rh = 1.9 nm and Rh = 3.6 nm (bottom). (e) This binary mixture could not be characterized using sizing techniques that do not involve pre-fractionation steps, such as dynamic light scattering (DLS; light blue dotted line). Its sizing was possible using the device described in this work (dark blue continuous line). Credit: Microsystems & Nanoengineering, doi: 10.1038/s41378-019-0072-3
In total, the microfluidics platform with the separation unit directed a fraction of the fluid flow to an MDS unit, which the research team connected to analytical SEC-MALS to identify the fractions leaving the separation module. To analyze the data and obtain average molecular size for each fraction, they used a numerical solver predicting the generation of particle distributions. Saar et al. compared the predicted distributions with experimental data and extracted the hydrodynamic radii of the particles in each fraction.
They imaged the nozzle at which the sample met the carrier medium as a reference point on particle movement. The scientists adjusted the diffusional sizing channel or flow rate to accurately size the analyte molecules, orders of magnitudes larger or smaller in size. Since they engineered the microfluidics platform using Poly(dimethylsiloxane) (PDMS), the scientists eliminated any autofluorescence in the setup before analyzing the image data.
They then used the device to analyze a binary mixture of sample proteins; bovine serum albumin and human lysozyme. To preserve the native states of the protein molecules they imaged the label-free samples with a home-built UV-wavelength based microscope and quantified the intrinsic fluorescence of the sample. Saar et al. confirmed the ability to separate the mixture into its components by first applying a set of voltages to record the fluorescent profiles. They then recorded the electrophoretic mobilities of the proteins (µ e1) combined with the flow rate in the device to characterize most proteins and their complexes. The scientists altered the flow rate or the applied voltage to analyze biomolecules with diverse biophysical parameters.
Using the platform, they rapidly characterized mixtures of nanoscale molecules, where individual analytes showed similar sizes but diverse electrophoretic properties. Based on the resulting histogram, the research team confirmed the presence of two distinct samples. Comparatively, in an off-chip conventional separation approach, the latter step required fractionation by sample transfer from one analytical tool to another via interconnected tubes, limiting device performance. The total protein concentration in the study approximated 100 µM and the scientists accurately detected the sensitivity limit to an approximate 100 nM, relative to the intrinsic fluorescence of protein fractions. For optically non-active compounds, Saar et al. suggest an alternative detection and characterization strategy such as dry mass sensing.
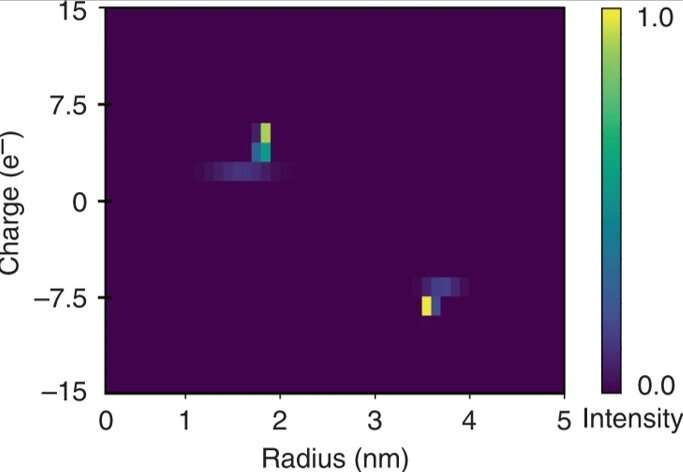
Rapid two-dimensional characterization of a mixture of bovine serum albumin and human lysozyme. The quantitative nature of the electrophoretic separation unit allowed the applied potential to be related to the electrophoretic mobility μel of each of the fractions. These data were used in combination with the extracted hydrodynamic radii (Rh) to estimate the effective charges (q) of the molecules in each of the fractions and to construct a two-dimensional q vs Rh map of the mixture over a few minutes timescale by monitoring the device only at a single imaging frame. Credit: Microsystems & Nanoengineering, doi: 10.1038/s41378-019-0072-3
Saar et al. used the strategy to obtain two-dimensional (2-D) characteristic maps of the protein mixture as a proof-of-concept. They extracted quantitative information from the separation step and related the applied potentials to the electrophoretic mobilities of the species to estimate the device efficacy. They recorded the current flowing in the system during normal operation and when the separation chamber was short-circuited to estimate the total electrical resistance of the device and the electrodes.
The researchers calculated the electrophoretic mobility as the movement of a particle in an electric field for each of the fractions. Based on the experimental data, the constructed 2-D characteristic map included the effective charge (q) and the hydrodynamic radius (Rh) of the mixture. The resulting elementary charge units of the specific proteins agreed with estimated values elsewhere. They obtained the full two-dimensional map by only monitoring a single imaging frame for rapid in solution analysis.
The analytical time of the microfluidics device from separation to diffusional sizing and imaging approximated 14 seconds. The scientists constructed the experimental 2-D map using only 3 µL of sample across seven minutes in total, orders of magnitude faster than the time-scale to perform conventional 2-D protein gels. The research team conducted a wide range of biomolecular interactions, in solution, directly under native conditions that were previously challenging to perform in the lab.
In this way, Kadi L. Saar and co-workers developed a microfluidic device combining on-chip separation with direct on-chip analysis to replace the existing conventional microscale approaches. Using the device, they rapidly analyzed a binary mixture of proteins that could not be identified as individual components via existing solution sizing approaches. They constructed a 2-D characteristic map of the heterogenous mixture on a rapid time-scale to open the possibility of protein characterization in solution at an unprecedented time-resolution compared to existing biophysical techniques.
More information: Kadi L. Saar et al. Rapid two-dimensional characterisation of proteins in solution, Microsystems & Nanoengineering (2019). DOI: 10.1038/s41378-019-0072-3
George M. Whitesides. The origins and the future of microfluidics, Nature (2006). DOI: 10.1038/nature05058
Mathew H. Horrocks et al. Fast Flow Microfluidics and Single-Molecule Fluorescence for the Rapid Characterization of α-Synuclein Oligomers, Analytical Chemistry (2015). DOI: 10.1021/acs.analchem.5b01811
T. Müller et al. Dry-mass sensing for microfluidics, Applied Physics Letters (2014). DOI: 10.1063/1.4902131
Journal information: Analytical Chemistry , Nature , Applied Physics Letters
© 2019 Science X Network


