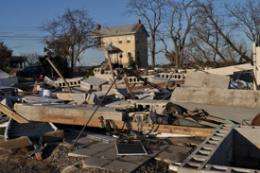
Massive destruction in Union Beach caused by Hurricane Sandy ripped the home off its' foundation and deposited it, whole, in a near-by marshy area. Credit: FEMA
(Phys.org) —If sea level rises as scientists predict, will your New Jersey home or parts of your town be underwater?
Rutgers University and the National Oceanic and Atmospheric Administration have unveiled an online mapping tool that offers a disturbing look at which parts of the state are in danger of severe flooding if the ocean and bays continue to rise as expected. That map shows where schools, hospitals, fire and police stations are in the flood zones and illustrates the vulnerabilities posed by future severe storms.
The goal of the project is to help towns and counties prepare for rising sea level.
"While sea level rise is a global phenomenon, adapting to its impacts is a local decision-making challenge that is going to require site-specific remedies," said Richard Lathrop, professor of environmental sciences and director of the Grant F. Walton Center for Remote Sensing and Spatial Analysis. "Hurricane Sandy showed us that local land-use planners and managers need access to detailed, information about what and who may lie in the path of rising sea levels – and the path of high tides and storm surges built on top of those new, higher sea levels."
With NJ Flood Mapper, anyone can simulate sea level rises of from one foot (the rise many scientists expect in the next 50 years) to six feet. The user can see the advisory based flood elevation information recently released by the Federal Emergency Management Agency that shows what areas are vulnerable to coastal flooding, and 100-year and 500-year-flood information. Maps depicting areas affected by Hurricane Sandy's storm surge are also included. In addition, the tool allows a user to display the location of key buildings like hospitals, firehouses, and schools. Finally, NJFloodMapper will also show which communities are most vulnerable to the effects of sea level and flooding – not just because of their location, but because of the age and relative poverty of their people. Poverty can affect a community's ability to prepare for storms and rebuild afterwards. NJFloodMapper also includes "street views" at selected locations, that demonstrate what sea level rise will look like from 1-6 feet.
Lathrop and his colleagues at the Center for Remote Sensing and Spatial Analysis created NJFloodMapper in collaboration with NOAA's Coastal Services Center. Lisa Auermuller, watershed coordinator for the Rutgers-managed Jacques Cousteau National Estuarine Research Reserve, organized discussions with municipal and county level officials to provide data for NJFloodMapper, as well as sessions in which officials tested the tool. This project was funded by NOAA's Cooperative Institute for Coastal and Estuarine Environmental Technology, Sustainable Jersey, New Jersey SeaGrant, and the New Jersey Department of Environmental Protection.
NJFloodMapper has been more than three years in the making. Auermuller said she and Lathrop involved local and county officials from the beginning. "We didn't assume that 'if we built it, they will come,'" she said. "We listened to what they wanted, and included that in the project, so we knew the finished product would be useful."
The officials were helpful and enthusiastic, she said, but were more focused on flooding – something they dealt with routinely – than sea-level rise. Hurricane Sandy, however, made them much more conscious of what a foot of sea-level rise could do to their communities.
More information: njfloodmapper.org/
Provided by Rutgers University


