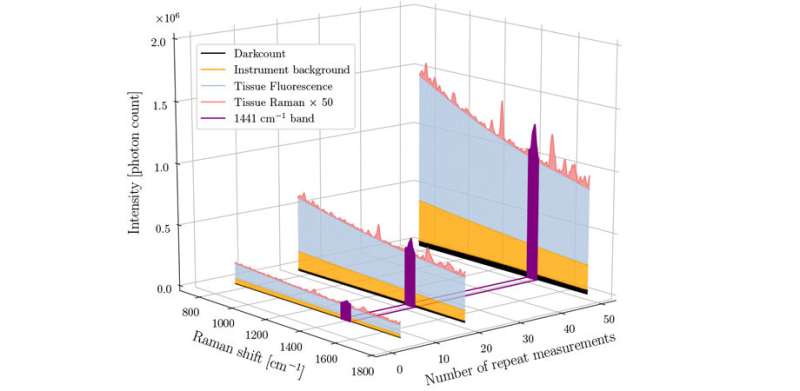
Depiction of the relative proportion of different sources of signal in a human brain measurement made using a Raman spectroscopy system. From Fig. 1, doi: 10.1117/1.JBO.25.4.040501 Credit: SPIE
"The technique of Raman spectroscopy—in combination with emerging machine-learning methods—is making its way into operating rooms at a rapid pace, with the prospect of improving the accuracy of surgical procedures in a wide range of oncology applications, including neurosurgery," says Frédéric Leblond, professor of engineering physics at Polytechnique Montréal. His team's new paper aims to accelerate the uptake of Raman spectroscopy in biomedicine by increasing the confidence that clinicians can have in the results.
Named after Indian physicist C. V. Raman, who first observed Raman scattering in 1928, Raman spectroscopy uses a high-intensity laser to investigate molecules. The light scattered back by the molecules gives information about their structure and bonding, so Raman spectroscopy can be used to sense and identify chemical changes. In medicine, this scattering technique provides "chemical fingerprints" of cells, tissues, or biofluids, giving researchers rich biomolecular information which could reveal the causes and effects of disease.
When compared with other analytical techniques such as histology, X-rays, MRI, and PET scans, Raman spectroscopy offers several advantages including being non-invasive and non-destructive, and using non-ionizing radiation. There is typically no sample preparation, and researchers can choose how much or how little of a sample to analyze. Additionally, almost all materials exhibit Raman scattering. Pure metals will only reflect light, but metallurgists can use Raman spectroscopy because carbides, nitrides, and oxides will do Raman scattering.
Despite these advantages, Raman spectroscopy is a low-signal technique that requires relatively long acquisition times and, until now, there has been no efficient way to monitor and ensure intra-operative Raman signal quality. This deficit hampers clinical translation of the technique by limiting the ability to train robust and accurate machine-learning cancer detection models. It also limits the reliability of intra-operative data acquisition, often requiring extra personnel to visually monitor data quality live during a procedure.
Measuring signal quality
In a recent paper in the SPIE Journal of Biomedical Optics (JBO), Leblond and his team address this issue and describe their efforts to develop a quantitative method of evaluating Raman signal quality based on the variance associated with stochastic noise in important tissue bands.
"All too often, academic studies advance optical tools for medicine, but do not take a careful look at the quality of the spectral data being used to make decisions," says Brian Pogue, MacLean Professor of Engineering at Thayer School of Engineering at Dartmouth and editor-in-chief of JBO. "In the field of Raman spectroscopy, this can be particularly important because the data is inherently signal-to-noise limited, and very complex in nature. There are many molecular resonance peaks in the spectrum and they overlap and some have very small signal intensity. Advancing automated data analysis tools to ensure that the measured spectral data have sufficient high quality to make a medical decision is very important as these new techniques are advanced into clinical trials."
The paper details the development of a new technique that can unambiguously quantify Raman data quality based on the signal associated with specific molecular characteristics of the signal—specifically the presence of certain protein and lipid bands. This method can be used to automatically monitor Raman signal quality during surgical procedures and was demonstrated to improve the accuracy of brain cancer detection.
Quantifying the quality
To test the method, the team used a dataset of 315 in situ spectra from 44 brain cancer patients acquired using a single-point, hand-held Raman spectroscopy probe system developed by Leblond and his team. Before being presented to three independent reviewers for qualitative evaluation, the spectra were randomly shuffled and their assigned pathology label hidden. Specific criteria such as visual assessment of ubiquitous Raman tissue peaks were employed.
In another test, 15 in vivo brain measurements were made during surgery for glioblastoma in one patient to evaluate the number of repeat measurements on the Raman signal-to-noise ratio. They found that their method can separate high- and low-quality spectra with a sensitivity of 89% and a specificity of 90%—this can increase cancer detection sensitivity and specificity by up to 20% and 12%, respectively.
"This new study by Fred Leblond and his research group at Polytechnique Montreal and the CHUM Research Center advance the concept of making medical diagnoses-based spectral measurements that are validated by quality metrics of the data," says Pogue. "This group has done some of the most pioneering studies in using Raman spectroscopy in neurosurgery, and they have a series of publications advancing each aspect of the instrumentation, the data analysis and visualization tools, and advancing the clinical trials. This current paper focuses on the key underattended issue of testing and quantifying the quality of the spectra as it is used for decision making in medicine."
More information: Quantitative spectral quality assessment technique validated using intraoperative in vivo Raman spectroscopy measurements, Journal of Biomedical Optics (2020), doi: 10.1117/1.JBO.25.4.040501
Journal information: Journal of Biomedical Optics
Provided by SPIE


