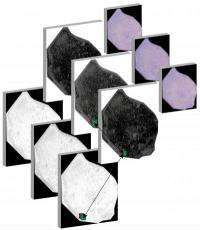
This image shows, from the top right: average annual rainfall; Middle: satellite imagery for the wet season; Bottom left: satellite imagery for the dry season. Patterns are shown for three consecutive years among the 28 analyzed. Credit: Matteo Convertino
Analysis of texture differences in satellite images may be an effective way to monitor changes in vegetation, soil and water patterns over time, with potential implications for measuring biodiversity as well, according to new research published Oct. 24 by Matteo Convertino from the University of Florida and colleagues in the open access journal PLOS ONE.
The authors designed statistical models to estimate two aspects of biodiversity in satellite images: the number of species in a given region, or 'species richness', and the rate at which species entered or were removed from the ecosystem, a parameter termed 'species turnover'.
They tested their models on data gathered over 28 years in a water conservation area in the Florida Everglades and compared their results to previous reports from the region. They found that their models were nearly 100% accurate when predicting species turnover; conventional methods only have 85% accuracy.
According to the authors, their automated method using satellite images could help improve the efficiency and decrease the cost of campaigns that monitor biodiversity and guide policy and conservation decisions. Convertino says, "Texture-based statistical image analysis is a promising method for quantifying seasonal differences and, consequently, the degree to which vegetation, soil, and water patterns vary as a function of natural and anthropic stressors. The application of the presented model to other fields and scales of analysis of ecosystems is a promising research direction.''
More information: PLOS ONE 7(10): e46616. doi:10.1371/journal.pone.0046616
Journal information: PLoS ONE
Provided by Public Library of Science


