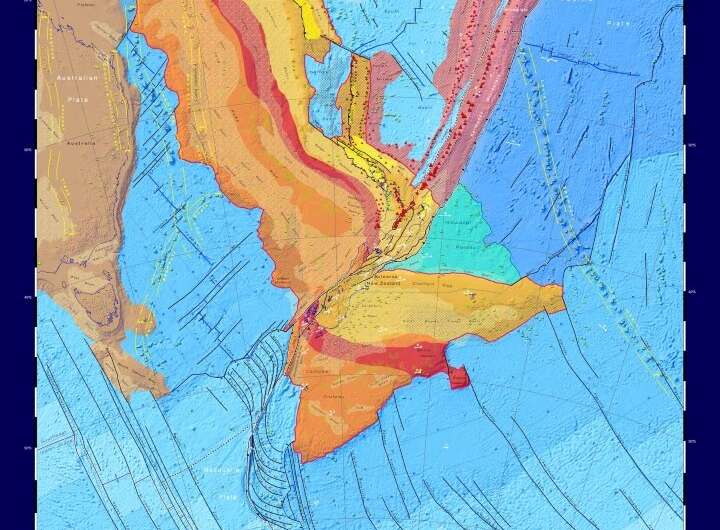
The tectonic map highlights the 5 million sq km Te Riu-a-Māui / Zealanda continent, a small part of which is on land, but most of which is under the sea. The colours show continental crust in red, orange, yellow and brown hues and oceanic crust in blues. Island arc crust is pink and large igneous province crust is green. (A large igneous province is a large accumulation of igneous rocks resulting from magma travelling through the crust towards the surface). Credit: GNS Science
Two maps and a website released by GNS Science this week give insights into the amazing forces that shaped Aotearoa New Zealand and the mostly submerged continent that lies beneath our feet.
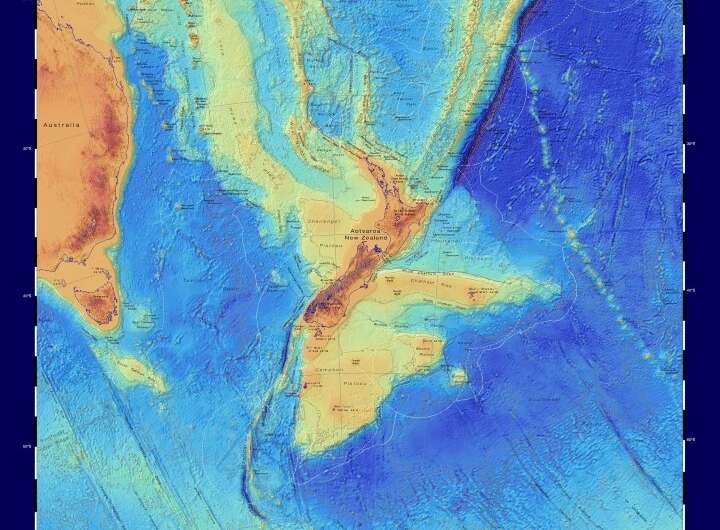
The maps cover the bathymetry (shape of the ocean floor) and the tectonic origins of Earth's eighth continent—the 5 million square kilometer Te Riu-a-Māui / Zealandia on which New Zealand sits.
They can also be accessed through a new interactive website called E Tūhura—Explore Zealandia (TEZ) – data.gns.cri.nz/tez. TEZ is designed for exploring onland and offshore geoscience data in and around Te Riu-a-Māui/Zealandia.
"These maps are a scientific benchmark—but they're also more than that. They're a way of communicating our work to our colleagues, stakeholders, educators and the public," lead author of the maps, geologist Dr. Nick Mortimer says.
"We've made these maps to provide an accurate, complete and up-to-date picture of the geology of the New Zealand and southwest Pacific area—better than we have had before.
"Their value is that they provide a fresh context in which to explain and understand the setting of New Zealand's volcanoes, plate boundary and sedimentary basins."
The TEZ website presents a wealth of maps, graphics and other information on the continent compiled in GNS Science research programs.
The bathymetric map uses the GEBCO 2019 grid, the first output of the Seabed2030 project which is a global initiative to map the ocean floor of the entire world by 2030. The project is a collaboration between The Nippon Foundation in Japan and the General Bathymetric Chart of the Oceans (GEBCO). NIWA, GNS Science and Land Information New Zealand are jointly leading the South and West Pacific Ocean Regional Data Assembly and Coordination Centre, based in Wellington. Credit: GNS Science
Programme Leader Vaughan Stagpoole says TEZ provides the perfect way for users to explore geoscience data from the comfort of their homes or offices.
"Users can zoom and pan around different thematic geoscience webmaps of the region. They can readily view and interrogate the maps and turn layers on or off. They can also query features in the layers and generate custom maps of their own," Dr. Stagpoole says.
As more research results become available, GNS Science will update the maps and add more information to the interactive website.
Copies of the printed maps are available either as flat or folded at $15 each ($25 for the pair). PDF files can be downloaded at no cost. Both maps and PDFs are available through the GNS Online Store. An accompanying GNS Science Report 2020/01 lists the data sources used to compile the map posters. The GIS layers from the posters are also available through the TEZ interactive website.
More information: Zealandia interactive website: data.gns.cri.nz/tez
Provided by GNS Science


