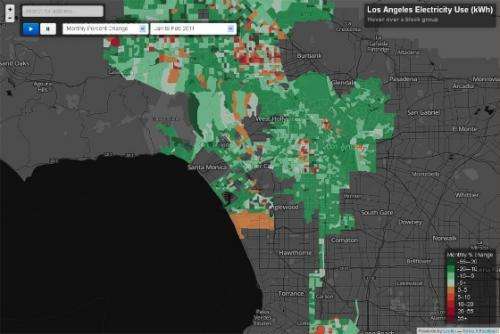
UCLA center creates first interactive electricity-use map of Los Angeles

(Phys.org) —A new energy map of Los Angeles developed at UCLA lets residents find how much electricity the average customer in their neighborhood uses, see how a neighborhood's energy use relates to its average income level and track energy use over time.
The map, released March 28 by UCLA's California Center for Sustainable Communities, is the most highly interactive map of Los Angeles' energy use ever developed. The center used commercial and residential customer data from the Los Angeles Department of Water and Power and collaborated with the California Governor's Office of Planning and Research to produce the map.
Researchers from the UCLA center hope the map will help policymakers pinpoint the best locations for future energy-efficiency programs, show residents whether they are using more or less energy than their neighborhood average and highlight the important links between land use and energy use, among many other applications. The map is available at sustainablecommunities.environment.ucla.edu/map.
"This is providing decision-makers, energy-users and the public with the most complete picture of energy use for any location in the state," said Stephanie Pincetl, director of the project and the center and a professor at UCLA's Institute of the Environment and Sustainability, where the center is housed. "Residents and utilities have never had the capacity to look at energy like this before."
The interactive map shows the average customers' monthly electricity consumption for every census block group (slightly larger than a census block) in Los Angeles for each of the 18 months from January 2011 to June 2012. The map can show the average electricity use or the rate of increased or decreased use from the previous month. Users can animate the results to show changes over time or zero in on a specific census block group to see the average income, the average age of the buildings and the percentage of residential, commercial and industrial land uses.
"At a time when we are making unprecedented investments in energy efficiency and have set a goal to use at least 10 percent less energy by 2020, this detailed view of electricity use in L.A. will allow the Department of Water and Power and its customers to make smarter decisions about conservation, investment and planning," said the utility's general manager, Ronald O. Nichols. "We are proud to have partnered with UCLA on this very insightful, first-of-its-kind study."
The map is the first in a series that UCLA's California Center for Sustainable Communities will develop under Pincetl's leadership, and future maps will add layers such as average electric bills, average number of people per household, average square footage of buildings and average energy use, sorted by industrial sector. The current map was created by Jacki Murdock, a researcher at the center and a graduate student in urban planning at UCLA's Luskin School of Public Affairs. Yoh Kawano, the geographic information systems coordinator for UCLA's Institute for Digital Research and Education, advised on the mapping efforts.
The researchers had an unprecedented degree of detail to inform their behind-the-scenes work, with energy use for every customer, which they stripped out of the public map to preserve privacy. Electricity use, measured by kilowatt hours (kWh), was totaled for each block group and divided by the number of customers to obtain the average for the public map.
"This is the first time that we're really able to see what consumption patterns are in the city," said Murdock. "It really helps reveal the connections between land use and energy demands and can help decision-makers better plan the energy grid to address future demand."
Provided by University of California, Los Angeles


