A new way to imagine grid stability

To ensure that the US electric grid remains stable and resilient, power generators in three main regions (Eastern, Western, and Texas) must be synchronized, all operating at the frequency of 60 hertz. Because generators interact with each other through a network of transmission lines, if one generator gets out of sync, it can disrupt the stability of the entire system and lead to outages for power consumers.
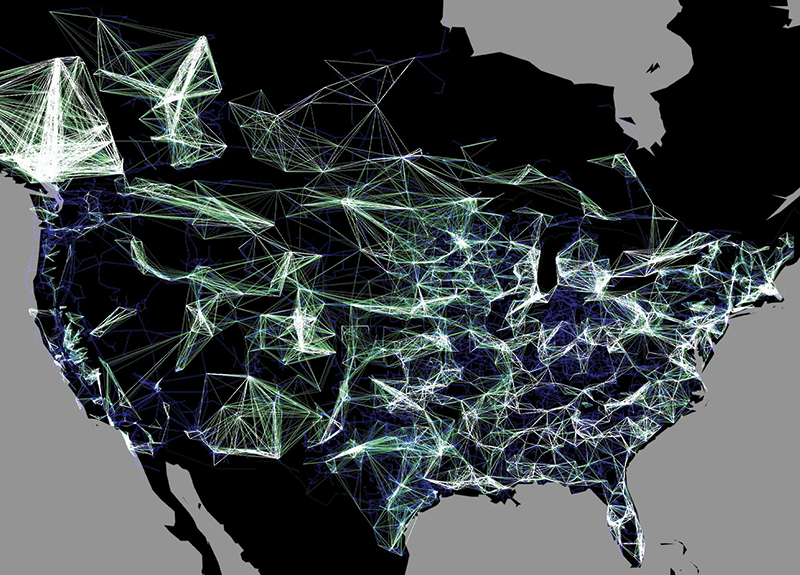
Integrating renewable energy sources, which generate electricity intermittently, can also lead to disturbances. Through a grant from the US Department of Energy's Advanced Research Projects Agency (ARPA-E), Takashi Nishikawa, research associate professor in Northwestern's Department of Physics and Astronomy, and his colleagues are working to develop a new frequency-based load control architecture for power grids that integrates increased portions of electricity generation from renewables. Here, Nishikawa describes how network visualization maps like the one above help us to understand the locations, strength, and nature of interactions on the grid.
ISEN: What does this network map help us visualize?
TAKASHI NISHIKAWA: The image visualizes the network of interactions between generators in power plants across the United States. A line is drawn between the locations of two generators that mutually influence their frequencies. The blue network in the background shows the connections between generators through transmission lines and substations.
ISEN: What do the colors and clusters represent?
TN: Each line is color-coded by how strong the influence is, from dark green (weakest) to white (strongest). A cluster of white links represents a group of generators that are strongly coupled; in such a group, frequency disturbances in one are very likely to disturb others.
ISEN: What can we learn from mapping power grid networks?
TN: This mapping tells us that the network is very heterogeneous: the mutual influence between some pairs of generators is much stronger than others, with the strength varying across multiple orders of magnitude. This creates a real challenge for modeling and predicting the power grid's dynamics.
ISEN: What does your expert eye see when you look at one of these maps?
TN: We see a huge difference between the pattern of physical connections among generators through transmission lines and the pattern of influence connecting them through electrical interactions. The latter matters for the behavior of the grid under small disturbances, and studying the mathematical properties of that pattern gives us insights into how to measure, analyze, and control the grid.
ISEN: What/who do you hope this mapping will inform?
TN: Network visualization informs grid operators, as well as the energy industry and decision makers, of the scale, complexity, and interdependencies associated with the problem of power grid dynamics. Analysis of the influence pattern could be used to identify parts of the grid that are more likely to benefit from upgrades, such as the installation of additional transmission lines.
Provided by Northwestern University


