This article has been reviewed according to Science X's editorial process and policies. Editors have highlighted the following attributes while ensuring the content's credibility:
fact-checked
trusted source
proofread
New insights into how to improve modeling of crop nitrogen–biomass relations for wheat nitrogen management

Wheat, vital for global food security, faces challenges of increased demand and limited arable land. Nitrogen (N) fertilizers, crucial for high yields, may adversely affect both plant growth and the environment, underscoring the importance of efficient N management.
The critical N concentration (Nc) concept is key for determining plant N status and fertilizer optimization.
Recent research points to limitations in traditional Nc dilution curves based on shoot biomass, advocating the consideration of leaf biomass due to its photosynthetic response to N. Variability in these curves, influenced by genotype, environment, and management, presents uncertainties in crop modeling. Existing research gaps encompass inconsistent nitrogen nutrition indices derived from different Nc curves and a lack of studies on organ-based Nc dilution curves specific to wheat.
In July 2023, Plant Phenomics published a research article titled "Interaction of genotype, environment and management on organ-specific critical nitrogen dilution curve in wheat."
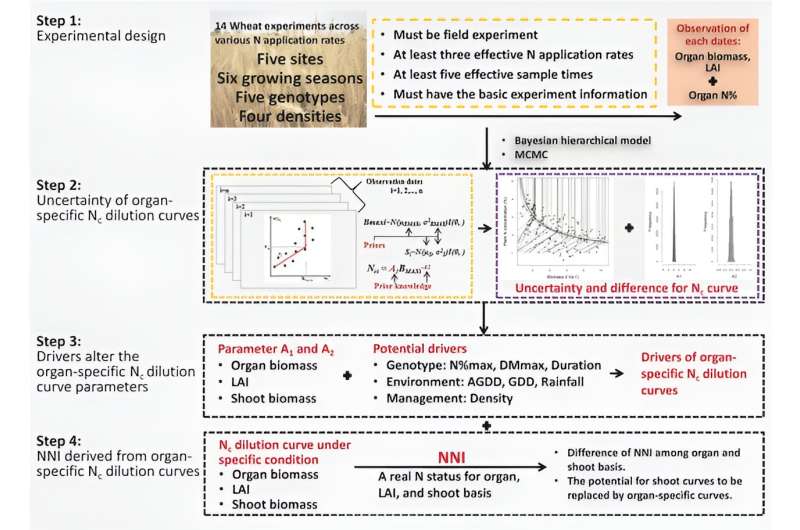
This study utilized data from 14 wheat nitrogen (N) fertilizer experiments under varying genotype, environment, and management (G × E × M) conditions to develop and compare organ-specific critical N concentration (Nc) dilution curves, analyze their uncertainties, and investigate variations in parameters.
The study found significant differences in the parameters of Nc dilution curves for leaf, stem, shoot biomass, and leaf area index (LAI) across genotypes and planting environments. The variability of parameters A1 (starting position) and A2 (dilution rate) was impacted by G × E × M interactions, with leaf biomass showing the least variation.
Curve parameters A1 and A2 were correlated with various factors like vapor pressure deficit (VPD), shoot N concentration (Nmax), maximum shoot biomass (DMmax), and average growing degree days (AGDD). However, these parameters were less affected by genotype differences.
Environmental characteristics like rainfall showed no significant correlation with curve parameters. Nc concentration generally decreased with increasing biomass and LAI. Leaf Nc maintained high concentrations during the vegetative growth period, whereas stem Nc concentration declined more rapidly. There was a notable variation in Nc curves under different experimental conditions.
The study also compared different organ-based nitrogen nutrition indices (NNIs). NNI values increased with higher N fertilizer rates for each organ basis. Leaf biomass maintained higher NNI values with smaller variation compared to stem biomass. The relationship between organ-specific NNI and shoot biomass-based NNI revealed differences in N status among different plant organs.
In conclusion, the findings emphasize the need for improved modeling of crop nitrogen–biomass relations and N management practices under varying G × E × M conditions, offering valuable insights for enhancing crop growth models.
More information: Bo Yao et al, Interaction of Genotype, Environment, and Management on Organ-Specific Critical Nitrogen Dilution Curve in Wheat, Plant Phenomics (2023). DOI: 10.34133/plantphenomics.0078
Provided by NanJing Agricultural University


