This article has been reviewed according to Science X's editorial process and policies. Editors have highlighted the following attributes while ensuring the content's credibility:
fact-checked
trusted source
proofread
Creating universal critical nitrogen dilution curves for Japonica rice

Rice, a staple crop, is widely cultivated in China. The farmers enhance the rice yield and grain quality through nitrogen (N) fertilizers. But using them in excess negatively affects crop production and harms the environment. Therefore, determining the optimum quantity of N fertilizers for effective rice growth without any wastage is crucial.
Researchers do so by creating critical N (NC) dilution curves that relate the NC concentration of plants to their dry matter weight (DW) or biomass as a power function—NC = a × DW-b. In this equation, NC is the minimum N concentration at which the growth rate of DW is maximum, and a and b are parameters that depend on rice cultivars or varieties and environmental conditions.
Researchers traditionally estimated the parameters a and b by sampling and weighing plant measurements, which is laborious and time-consuming. Therefore, machine learning methods are currently employed for this purpose. Some studies have used them to create NC curves for specific cultivars under particular environments. But a universal NC curve applicable in a region under various conditions would be more practical.
With this in mind, a group of researchers from China, led by Prof. Xiaojun Liu of Nanjing Agricultural University, has created universal NC dilution curves for 10 Japonica rice cultivars by conducting 13 N fertilizer-based experiments across 10 years at 7 sites in reaches of the Yangtze river. Their work was published in Plant Phenomics.
Prof. Liu briefly explains the research methodology of the present work. "Rice was cultivated using different quantities of N fertilizer in different ratios for various stages of plant growth during each experiment. After that, NC and DW were measured by a continuous-flow auto-analyzer and micrometer balance, respectively. And the parameters a and b were determined using three approaches—simple data mixing (SDM), random forest algorithm (RFA), and Bayesian hierarchical model (BHM)."
The researchers found that a and b varied with cultivar, year, site, and N fertilizer quantity and ratio. In particular, while a was highly related to plant height, specific leaf area at the end of tillering, and maximum DW during vegetative growth, b was affected by effective temperature accumulated by the end of tillering, stem-to-leaf DW ratio at the tillering end, and maximum leaf area index during vegetative growth. As a result, different rice growth conditions gave rise to different specific NC curves.
The researchers averaged the parameters a and b of the specific curves using RFA to create a universal NC curve. In contrast, while SDM involved fitting all NC points to a power function, BHM obtained posterior distributions of a and b using the Markov Chain Monte Carlo method. The distributions Most Probable Number (MPN) represented the universal values of the two parameters, respectively. Consequently, two more universal NC curves, corresponding to SDM and BHM-MPN, were obtained.
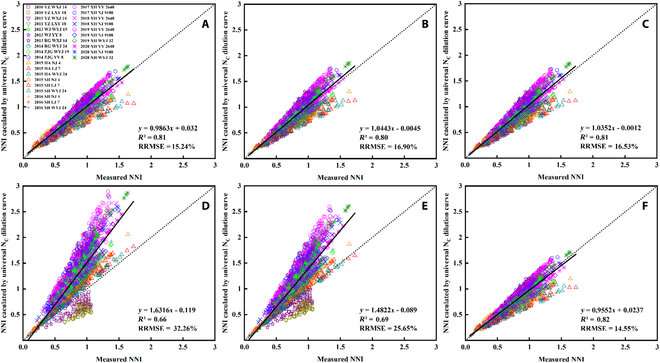
Having thus obtained three universal NC curves, the researchers validated their practicality by comparing their N nutrient index—the ratio of real-time measured N concentration to NC—to that of corresponding specific curves. "The coefficient of determination was above 0.81 for all three approaches. Thus, all universal NC curves can accurately determine real-time N concentration and the optimum quantity of N fertilizer. However, RFA and BHM-MPN approaches, compared to SDM, greatly simplify the modeling process and are highly applicable at a regional level," concludes Prof. Liu.
More information: Zhaopeng Fu et al, Potential of Establishing the Universal Critical Nitrogen Dilution Curve for Japonica Rice, Plant Phenomics (2023). DOI: 10.34133/plantphenomics.0036
Provided by NanJing Agricultural University


