September 12, 2019 feature
Dynamic charge density fluctuations pervading the phase diagram of a Cu-based high-Tc superconductor

Charge density fluctuations are observed in all families of high-critical temperature (Tc) superconducting cuprates. Although constantly found in the underdoped region of the phase diagram at relatively low temperatures, physicists are unclear how the substrates influence unusual properties of these systems. In a new study now published on Science, R. Arpaia and co-workers in the departments of microtechnology and nanoscience, the European Synchrotron, and quantum device physics in Italy, Sweden and France used resonant X-ray scattering to carefully determine the charge density modulations in Yttrium Barium Copper Oxide (YBa2Cu3O7– ẟ) and Neodymium Barium Copper Oxide (Nd1+xBa2–xCu3O7–ẟ) for several doping levels. The research team isolated short-range dynamic charge density fluctuations (CDFs) in addition to the previously known quasi-critical charge density waves (CDW). The results persisted well above the pseudo-gap temperature T*, which they characterized by a few milli-electron volts (meV) to spread across a large area of the phase diagram.
Cuprate high temperature superconductors (HTS) are different from the Landau Fermi liquid paradigm due to quasi-two dimensionality (2-D) of their layered structure and large electron-electron repulsion. During optimal doping and the pseudo gap state (states at which less than optimal current carrier concentrations result in anomalous electronic properties), short to medium-range charge density wave order can emerge to weakly compete with superconductivity. Physicists first developed theoretical proposals of CDW and low energy charge fluctuations after first discovering HTS. Subsequently, they developed experimental evidence in selective materials and in all cuprate families. Researchers had observed long-range tridimensional CDW (3-D CDW) order inside the superconductivity dome within high magnetic fields that weaken superconductivity or in epitaxially grown (deposition of a crystalline layer on a crystalline substrate) samples. Physicists currently debate the relevance of such charge density fluctuations (CDFs) on the unconventional normal state and on the superconducting state of HTS.
![Quasi-elastic scan along the (H, 0) direction for several YBa2Cu3O7–d and Nd1+xBa2–xCu3O7–d films with different oxygen dopings. The quasi-elastic intensity was determined by integrating the Cu L3 RIXS spectra measured at different q|| values in the energy interval [–0.2 eV, +0.15 eV]. The measurements were performed at different temperatures on the following samples: (A) Optimally doped NBCO, p ≈ 0.17. (B) Underdoped YBCO, p ≈ 0.14. (C) Underdoped NBCO, p ≈ 0.11. (D) Insulating NBCO, p < 0.05. The inset in (C) shows the peak intensity Ipeak versus T–1 for samples OP90 (circles) and UD60 (squares). The extrapolation to T → ∞ provides an estimate of the intrinsic background of the signal (bgr). Credit: Science, doi: 10.1126/science.aav1315 Dynamic charge density fluctuations pervading the phase diagram of a Cu-based high-Tc superconductor.](https://scx1.b-cdn.net/csz/news/800a/2019/1-dynamiccharg.jpg)
To establish the extent to which fluctuating and static charge density modulations contributed to the phase diagram in the present work; Arpaia et al. measured the variables in YBa2Cu3O7– ẟ (YBCO) and Nd1+xBa2–xCu3O7–ẟ (NBCO) as a function of doping and temperature. They discovered the presence of CDFs (charge density fluctuations) across a broad region of the phase diagram to strengthen the importance of charge density control, which determined the normal-state properties of cuprates. The new findings were consistent with previously observed short- to medium-range orders in high magnetic fields.
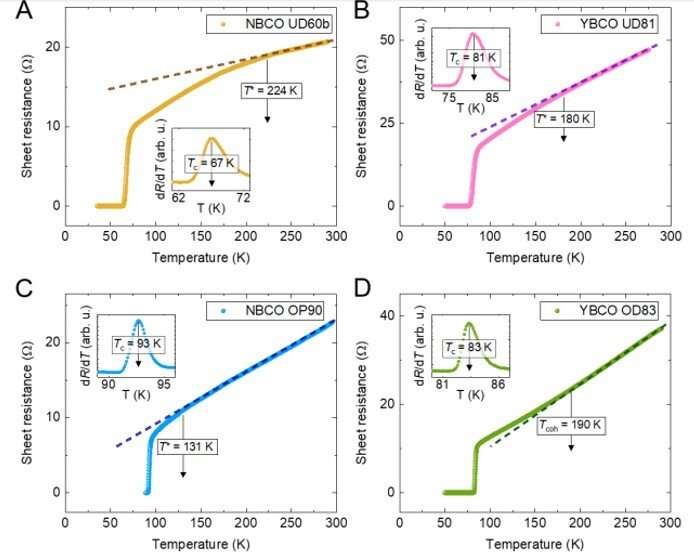
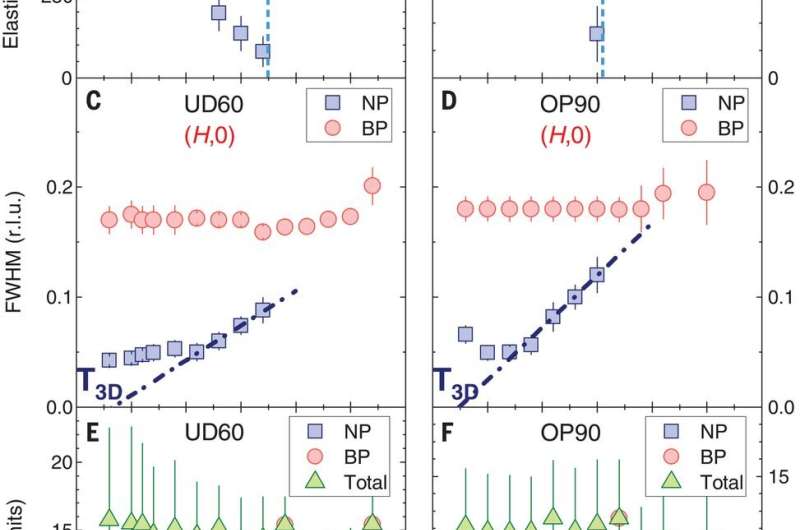
During the experiments, Arpaia et al. measured resonant inelastic X-ray scattering (RIXS) on five YBCO and NBCO films (which included NBCO: OP90, UD60 and YBCO UD81) spanning a range of oxygen doping phases. The researchers transferred the film from the antiferromagnetic region (AF) to the undoped (UD) and optimally doped (OP) region, up to the slightly overdoped region. The scientists observed quasi-elastic (near-zero energy loss) of the RIXS spectra at different temperatures for some samples. In contrast, the antiferromagnetic sample (NBCO AF) did not show peaks above the linear background. The researchers summed the outcomes of fittings for several samples and specifically observed two peaks at low temperatures; a broad peak (BP) and a narrow peak (NP). They observed the BP to share a similar position with NP but with a very different and almost constant temperature dependence. As a result, Arpaia et al. attributed the broad peak to very short-range charge modulations such as the charge density fluctuations of interest.
![Two distinct peaks in fits to NBCO UD60 data. (A) Quasielastic scan measured along (H, 0) on sample UD60 at T = 250 K (red circles). (B) After subtracting the linear background, given by the quasi-elastic scan measured along the Brillouin zone diagonal [open squares in (A)], a clear peak is still present, which can be fitted by a Lorentzian profile (dashed line). (C) Same as (A), but at T = 60 K (violet circles). (D) After subtracting the linear background [open squares in (C)], the data can be fitted with a sum of two Lorentzian profiles (solid line): one broader (dashed line), similar to that measured at 250 K, and the second one narrower and more intense (dotted line). (E) The 3D sketch shows the quasi-elastic scans measured along H (cubes) and along K (spheres) at T = 60 K on sample UD60, together with the Lorentzian profiles used to fit them. A narrow peak (NP, blue surface) emerges at qNP c = (0.325, 0) from a much broader peak (BP, red surface) centered at qBP c = (0.295, 0). Credit: Science, doi: 10.1126/science.aav1315 Dynamic charge density fluctuations pervading the phase diagram of a Cu-based high-Tc superconductor.](https://scx1.b-cdn.net/csz/news/800a/2019/2-dynamiccharg.jpg)
The team further studied the energy associated with the broad peak to understand the double character of the phenomenon and its effect on CDFs using high resolution instruments. They measured the RIXS spectra on specific samples at selected temperatures and at the wave vector of the broad peak maximum. At all temperatures, they noted the main peak to be slightly broader than the resolution of the instrument (40 meV) with a stronger inelastic component at higher temperature. They credited this quasi-elastic peak to phonons (atomic vibrations) due to elastic diffuse scattering from the sample surface imperfections and due to charge fluctuations. They observed the phenomenon to either be temperature independent or decrease upon cooling.
The team then used the information to better extract the charge density contribution. After further theoretical interpretations of the experimental results, Arpaia et al. showed the broad peak to result from dynamic CDFs with pure 2-D character relative to the individual copper oxide (CuO2) planes—characterized by non-critical behavior. They also confirmed the ultrashort-range nature of the broad peak. In contrast, they attributed the narrow peak to quasi-critical CDWs, which appeared only below the onset temperature (TQC). Such quasi-critical CDWs then competed with superconductivity of the cuprates.

After gathering the experimental data, the team visualized the scenario of a continuous crossover from pure dynamic CDFs (charge density fluctuations) at high temperature and all dopings to a quasi-critical CDW (charge density wave) below TQC. They then visualized a static 3-D CDW, which is typically hindered in the presence of superconductivity in the cuprate materials. The work showed that the hitherto disregarded dynamic CDFs in cuprates represented the bulk of the iceberg of the CDW phenomenon. The dynamic CDFs permeated a large part of the phase diagram, where their total scattering intensity dominated across all temperatures. The experimental dynamic CDFs did not compete with superconductivity—consistent with the theoretical proposal.
![Static and dynamic charge order in the phase diagram of the HTS cuprates. (A) The T-p phase diagram of cuprates is typically marked by the antiferromagnetic, pseudo gap, and superconducting regions (respectively characterized by the onset temperatures TN, T*, and Tc). Our results prove that most of these regions are pervaded by charge density modulations of some sort. The narrow peak describes the CDWs, manifesting in a region (pale blue) below TQC (crosses). These 2D CDWs are quasi-critical and are precursors of the static 3D CDWs (blue region). Even though we cannot directly access this dome without a magnetic field, the temperatures T3D (squares) that we infer from the T dependence of the NP FWHM agreed with those previously determined by NMR and hard x-ray scattering experiments. The broad peak describes short-range charge density fluctuations (CDFs), which dominate the phase diagram (red region), coexisting both with the quasi-critical 2D CDWs and with superconductivity, and persisting even above T*. In contrast, CDFs disappear in undoped/antiferromagnetic samples (white region), whereas their occurrence between p ~ 0.05 and p ~ 0.08 has yet to be determined. To evaluate the characteristic energies w0 associated with the BP, we measured high-resolution RIXS spectra at various temperatures on the samples OP90 and UD60. (B) Quasi-elastic component of the spectra (after subtraction of the phonon contribution) at T = 90, 150, and 250 K, measured on sample OP90 at q|| = (0.31, 0). (C and D) The experimental 150 K–250 K and 90 K–150 K difference spectra, presented in (B), are shown (spheres), together with the theoretical calculation (solid areas). The data agreed with the theory, assuming w0 ≈ 15 meV at 150 and 250 K and w0 ≈ 7 meV at 90 K [dashed lines in (C) and (D)]. Credit: Science, doi: 10.1126/science.aav1315 Dynamic charge density fluctuations pervading the phase diagram of a Cu-based high-Tc superconductor.](https://scx1.b-cdn.net/csz/news/800a/2019/4-dynamiccharg.jpg)
In addition, the weak coupling of the CuO2 planes in the materials resulted in CDW orders displaying a marked 2-D character. Due to strong quantum thermal dynamic fluctuations such cuprates only required a truly static character below a temperature at which a static 3-D CDW order formed (T3-D). To suppress superconductivity of the YBCO and NBCO cuprates and obtain static 3-D CDWs the scientists therefore required strong magnetic fields or epitaxially grown samples. The research team aim to test other cuprate families and extend the doping regions to confirm the general applicability of the dynamic CDF scenario observed in the present work.
In this way, Arpaia et al. presented the most intriguing findings of the work to be the abundant presence of a broad peak caused by dynamic CDFs, with small energies of a few meV extending across a broad momentum range. The low energy scattering mechanism of quasiparticles observed in the study made the cuprates an appealing candidate to produce the Fermi liquid phenomenon. The features that were experimentally demonstrated in the present work had thus far defined the most prominent peculiarities of cuprate high temperature superconductors.
More information: R. Arpaia et al. Dynamical charge density fluctuations pervading the phase diagram of a Cu-based high-Tc superconductor, Science (2019). DOI: 10.1126/science.aav1315
C. M. Varma et al. Phenomenology of the normal state of Cu-O high-temperature superconductors, Physical Review Letters (2002). DOI: 10.1103/PhysRevLett.63.1996
Journal information: Science , Physical Review Letters
© 2019 Science X Network


