This article has been reviewed according to Science X's editorial process and policies. Editors have highlighted the following attributes while ensuring the content's credibility:
fact-checked
trusted source
proofread
AI analysis of satellite images shows 1990s USSR collapse increased methane emissions, despite lower oil, gas production

The collapse of the former Soviet Union in 1991 yielded social, political and economic effects worldwide. Among them was a suspected role in slowing human-generated methane emissions. Methane had been rising steadily in the atmosphere until about 1990. Atmospheric scientists theorized that economic collapse in the former USSR led to less oil and gas production, and thus a slowdown in the rise of global methane levels, which has since resumed.
But new University of Washington research uses early satellite records to dispute that assumption. The study, published in the Proceedings of the National Academy of Sciences, finds that methane emissions in Turkmenistan, a former Soviet republic and major oil producer, actually increased in the years following the dissolution of the Soviet Union.
"Methane has these enigmatic trends that we don't really understand," said senior author Alex Turner, a UW assistant professor of atmospheric sciences. "One that has always been fascinating is this slowdown in 1992. We find that the collapse of the Soviet Union seems to result, surprisingly, in an increase in methane emissions."
Carbon dioxide is more important than methane for long-term global warming, but methane plays an important role in the shorter term. One molecule of methane has more heat-trapping power than CO2, and its half-life in the atmosphere is just a decade, meaning its levels can fluctuate.
In recent years, the rise of methane accelerated during COVID-19 lockdowns. Turner's previous research showed that less driving and thus fewer vehicle emissions containing reactive nitrogen (an air pollutant) likely played a role, because pollution was no longer able to combine with methane molecules to remove them from the atmosphere.
The new study explores a longer-term conundrum: an abrupt slowing in the rise of methane concentrations in the atmosphere in 1992.
Methane's sources can be hard to untangle since they include both natural sources, such as wetlands, and human-related sources, such as fossil fuels, landfills, livestock digestion and manure. Pockets of methane gas can also escape during extraction of other fossil fuels. Methane is sometimes even burned, or flared, if it is not the main target of exploration.
The new study focused on Turkmenistan, a central Asian oil-producing country where economic data show that gas production dropped by 85% between 1991 and 1998. This steep decline suggests it played a major role in the region's overall drop in energy production. The country also has relatively little tree cover, making it a good candidate for satellite observations.

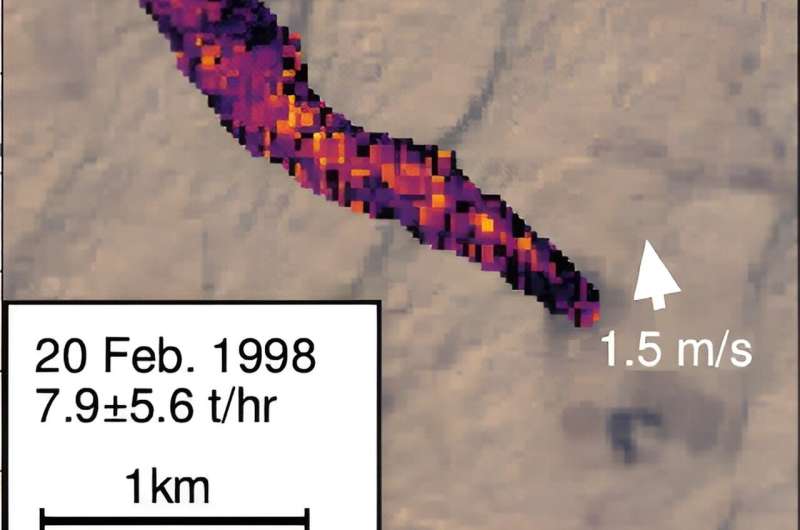
The authors used images of Turkmenistan taken by NASA's Landsat-5 satellite, one of the first Earth-observing satellites. First author Tai-Long He, a postdoctoral researcher in atmospheric sciences at the UW, and co-author Ryan Boyd, a former UW undergraduate, identified methane emissions in satellite images and then trained an AI model to catalog similar methane plumes in the entire data set.
"Our field has a lot of data sets, but we don't have very efficient tools to analyze them," said He. "This will become worse in the future with more satellites being launched, so we need the help of AI to improve our understanding of atmospheric phenomena."
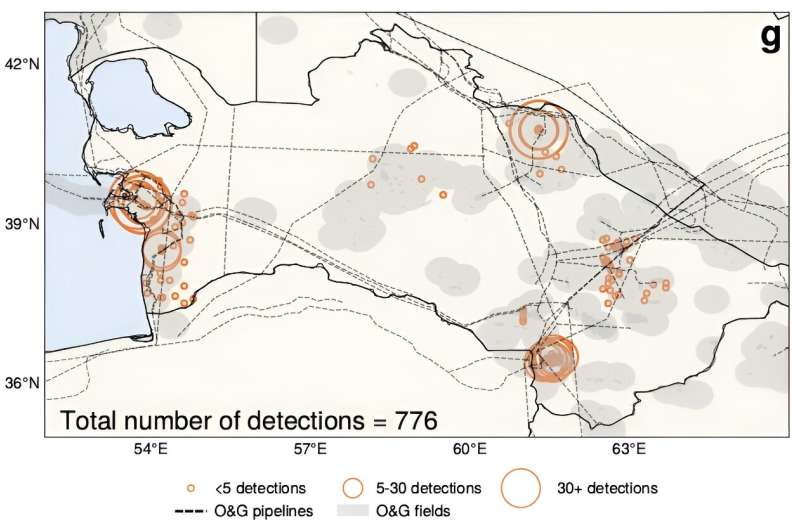
Their technique identified 776 plumes over the 25-year period from 1986 to 2011. Analysis shows methane plumes grew in size and became more frequent after 1991, when economic data for Turkmenistan show a decrease in gas production. In some oil and gas basins, methane plumes appeared in 80% to 100% of the clear-sky images during the post-collapse period.
The authors speculate that reasons might include failing infrastructure, broken components, less oversight of oil and gas wells, and fewer export routes, which led to more deliberate or unintentional off-gassing.
"The year 1994 stands out as the year with the largest methane emissions," Turner said. "That's fascinating because that's the year that Russia refused to allow Turkmenistan to pump gas through its pipelines to European markets. So we think the gas production was still reasonably high, but they couldn't sell their gas to anyone, resulting in more methane venting to the atmosphere."
The authors suspect the rest of the former Soviet republics would show similar trends to Turkmenistan, but they can't yet say for certain.
"More broadly, it begs the question of what drove the 1990s slowdown in atmospheric methane," Turner said. "I don't actually know. But when we started this work, I expected to confirm the hypothesis. So it was a pretty surprising finding."
The other co-author is Daniel Varon, a research scientist at Harvard University. Boyd is now a graduate student at Princeton University.
More information: Tai-Long He et al, Increased methane emissions from oil and gas following the Soviet Union's collapse, Proceedings of the National Academy of Sciences (2024). DOI: 10.1073/pnas.2314600121
Provided by University of Washington


