This article has been reviewed according to Science X's editorial process and policies. Editors have highlighted the following attributes while ensuring the content's credibility:
fact-checked
peer-reviewed publication
trusted source
proofread
Flood variability in the upper Yangtze River over the last millennium

A recent study led by Dr. Huo Ran (State Key Laboratory of Water Resources and Hydropower Engineering Science, Wuhan University) integrated reconstructed data and (global climate and hydrological) model simulations to better understand the variability of climate and hydrology over timescales ranging from decades to centuries.
They first drove hydrological models using the precipitation and temperature from four Global Climate Models (GCM), BCC-CSM1.1, MIROC, MRI-CGCM3, and CCSM4, to simulate daily discharge for the upper reach of the Yangtze River during the period of the last millennium (850–1849), historical period (1850–2005), and a future period (2006–2099).
The team found that:
(i) The MIROC model, differing from the other three GCM models, revealed positive temperature changes from the warm period (Medieval Climate Anomaly; MCA) to the cold period (Little Ice Age; LIA), while the temperature variability of the other models was similar to the records.
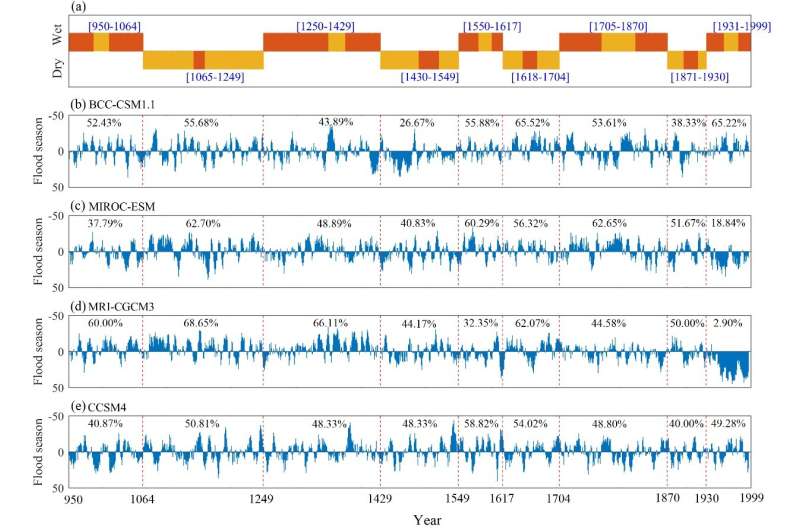
(ii) The BCC-CSM1.1 model performed better than the others regarding correlations between modeled precipitation and documented dry-wet periods.
(iii) Over most of the subbasins in the upper Yangtze River, the magnitude of extreme discharge in the BCC-CSM1.1 model results showed that there was a decrease from the MCA to the LIA period and an increase in the historical period relative to the cold period, while a future increase was projected by the four GCMs under the influence of climate change.
The paper is published in the journal Science China Earth Sciences.
More information: Ran Huo et al, Flood variability in the upper Yangtze River over the last millennium—Insights from a comparison of climate-hydrological model simulated and reconstruction, Science China Earth Sciences (2023). DOI: 10.1007/s11430-022-1008-5
Journal information: Science China Earth Sciences
Provided by Science China Press


