New, faster method to measure global warming shows no acceleration or slowdown

In a recent study published in Nature Communications, international scientists have taken on a persistent problem in climate science: near-term climate evolution.
"Common wisdom is that it may take up to 20 years before we can detect with certainty that a reduction in greenhouse gas emissions is also successfully reducing the rate of global warming. Our new method cuts this time in half, promising a faster response time for policy makers working on crucial mitigation efforts. At the same time, we can reveal that global warming still is on a steady course, with no acceleration or slowdown," says senior researcher Bjørn Hallvard Samset at CICERO Center for International Climate Research.
Internal variation vs. global warming
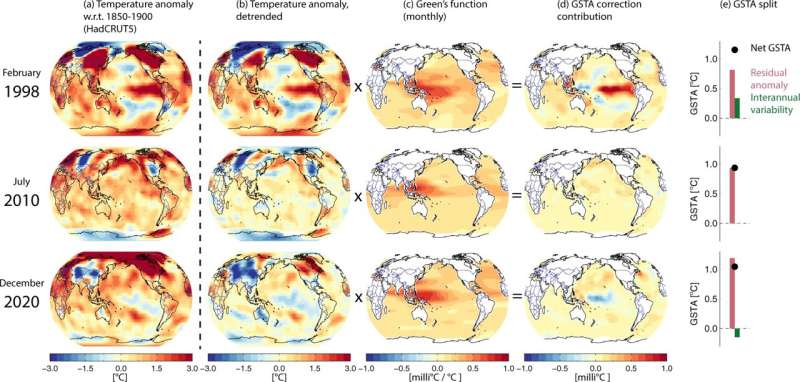
The global surface temperature in a given year is affected both by global warming and internal variation in the climate system. Examples of internal variation are the El Nino and La Nina phenomena in the Pacific, and the NAO-index in the North Atlantic. These variations are independent of global warming, but can still influence global temperature by up to 0,5 degrees Celsius each year.
When researchers calculate the rate of global warming, such fluctuations act as "noise" that makes the calculations of the actual warming more difficult, especially on shorter timescales such as 10–20 years. This is the reason that the IPCC-reports use global warming over the last 10 years (2001–2020), instead of only using the last year.
New method for noise reduction
CICERO scientists, in collaboration with colleagues from Germany, U.S. and China, have now developed a new method to reduce this noise, with promising results.
"We have used a modeling tool which connects the patterns of ocean surface temperature to fluctuations in the average global temperature. With the use of this tool, we can filter out the influence of for example El Nino and La Nina from the time evolution of global warming," explains senior researcher Marianne Tronstad Lund.
The new method makes it possible to more rapidly reveal whether cuts in greenhouse gas emissions are successful in reducing the rate of global warming. While the effects of cuts on global climate evolution will start immediately, the noise from internal variations mean that—up until now—verification in measurements could take up to 20 years.
"When we manage to reduce emissions, it will be crucial for continued efforts that we are able to show that the cuts have an effect," says Jan Fuglestvedt at CICERO Center for International Climate Research.
After noise removal, 2021 was the second warmest year
In the time since the article was written, researchers have used the new method on data from 2021 to remove "noise" from ocean surface temperature data. Rather than being what the big data sets show; the sixth or seventh warmest year, new results show that the "noise reduced" 2021 was only marginally colder than 2020.
"In second place, and documentation of global warming—sadly—continuing the same way as before.", explains Samset.
The rate of global warming continues as before
Another implication of the new method is that researchers get a clearer picture of the rate of global warming. Since 1970, they show that it has been remarkably constant, at approximately 0,2 degrees Celsius per decade. The rate has neither slowed or accelerated in recent years, as has been suggested by some researchers.
"We are on a steady course—towards a place we do not want to be. It's actually quite surprising how constant the increase of anthropogenic global warming has been over such a long time," says Samset.
More information: B. H. Samset et al, Earlier emergence of a temperature response to mitigation by filtering annual variability, Nature Communications (2022). DOI: 10.1038/s41467-022-29247-y
Journal information: Nature Communications
Provided by Centre for International Climate and Environmental Research (CICERO)


