This article has been reviewed according to Science X's editorial process and policies. Editors have highlighted the following attributes while ensuring the content's credibility:
fact-checked
peer-reviewed publication
proofread
How a climate model can illustrate and explain ice-age climate variability

Although humankind is responsible for the current global climate warming, our planet has constantly been undergoing natural climate fluctuations. Possible forcing mechanisms for this variability would have been changes in the brightness of the sun or explosive volcanic eruptions, but also interactions within the atmosphere/ocean/sea-ice system.
The duration of such an oscillation, also called variability, can vary considerably. Such climate variability is particularly important in climate research, especially for further improving our understanding of the effects of current anthropogenic climate change. However, with a few exceptions, there has long been a lack of clarity about climate oscillations that last for centuries.
Dr. Matthias Prange, Earth system modeler at MARUM and the Geosciences Department and first author of a new study published in Science Advances, explains, "Natural climate variability at time scales of hundreds of years is not yet well understood. For one, there are no observation time series that cover such long time periods. For another, there are only a few records of proxy data with sufficient resolution to shed light at this time scale.
"It has also been problematic that climate models to date have had great difficulty in depicting natural climate variability at time scales from 100 to 1,000 years."
Natural climate variability during peak glacial period four times stronger
The models have continued to improve in recent years, however, and the scientists working with Prange have now been able to use a well-tested climate model to take a closer look at natural climate variability on a time scale of 100 to 1,000 years during the last peak glacial period.
Available paleodata from ice and seafloor cores show that the natural climate variability intensified during the period between 23,000 and 19,000 years, and was globally as much as four times stronger than in the present Holocene. It was especially prominent in the North Atlantic.
"The fact that we now have climate models that can depict such changes in natural climate variability is a reflection of the great advances in climate modeling, and demonstrates the impressive capabilities of the models," says Prange.
Searching for factors for internal forcing
There is no evidence for external forcing for the multi-centennial climate variability. In the search for other causes the scientists turned their attention to possible internal mechanisms. "We used the well-known Community Earth System Model, CESM1.2. for short, which is also used for predictions by the Intergovernmental Panel on Climate Change, and fed it with the boundary conditions for the last ice age," says Prange. "We input the level of greenhouse-gas concentration, the extent of continental ice distribution, and the characteristic orbital parameters for the time."
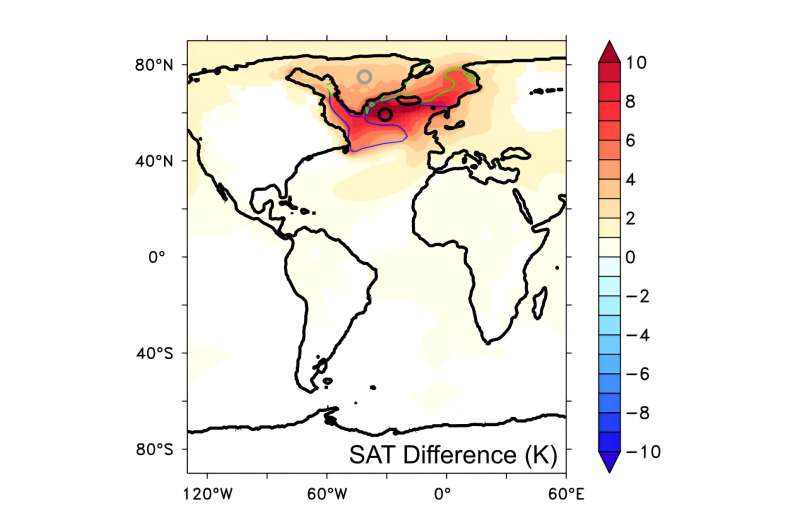
When the ice age was at its peak and most pronounced, the scientists were able to detect a spontaneous oscillation in the North Atlantic lasting several hundred years, accompanied by fluctuations in the Atlantic Meridional Overturning Circulation (AMOC). One cycle, in which the AMOC becomes stronger and then weaker, lasts around 400 years. This involves the transport of low-salinity water from the South to the North Atlantic.
Along the way it becomes even less saline, so that the seawater becomes lighter and does not sink as effectively into the depths of the North Atlantic. The production of deep water and its transportation toward the South Atlantic therefore becomes weaker.
The cyclic process is self-sustained, as the weakening of the AMOC results in less low-salinity water being transported northward again from the South Atlantic. Consequently, salinity in the North Atlantic may increase again, resulting in the production of more deep water.
As Prange explains, "These processes indicate that the multi-centennial climate variability is closely related to differences in the salinity and temperature in the water column." And although the amplitudes of the variation are low, there are clear effects on the extent of North Atlantic sea ice and on the temperatures in Greenland. "The average annual temperatures there vary by about 4°C as a result of the AMOC oscillations," concludes Prange.
High-resolution paleodata
In order to support these findings of the models, the scientists investigated the sea-surface temperatures for that time period. "To do this, we compiled and analyzed all of the high-resolution reconstructions from marine sediments of the North Atlantic," says Dr. Lukas Jonkers, co-author of the study and micropaleontologist at MARUM. "High-resolution here means that the data points of a series average no more than 200 years apart, with no single step greater than 1,000 years."
The paleoarchives studied provide evidence for recurring temperature oscillations in the surface waters every 150 to 1,000 years during the last glacial maximum, which is consistent with the modeled multi-centennial climate variability with internal forcing mechanisms.
Recent research findings underscore the importance of detailed study and understanding of feedback processes in the climate system. Prange emphasizes the need for a deeper understanding of climate variability at various time scales, as this could have ramifications for future climate change that could lead to unexpected and undesirable surprises for societies. These findings are also incorporated into the work of the Cluster of Excellence The Ocean Floor—Earth's Uncharted Interface, which is based at MARUM.
More information: Matthias Prange et al, A multicentennial mode of North Atlantic climate variability throughout the Last Glacial Maximum, Science Advances (2023). DOI: 10.1126/sciadv.adh1106
Journal information: Science Advances
Provided by MARUM - Zentrum für Marine Umweltwissenschaften an der Universität Bremen


