This article has been reviewed according to Science X's editorial process and policies. Editors have highlighted the following attributes while ensuring the content's credibility:
fact-checked
peer-reviewed publication
trusted source
proofread
Researchers construct first global map of insect mitochondrial genetic diversity

Understanding global patterns of species genetic diversity is an integral part of monitoring and preserving life on Earth. To date, however, scientists have mapped macrogenetic patterns in vertebrates exclusively. Macrogenetics uses publicly-available data to identify global drivers of genetic diversity. Only 5% of all known living animal species are vertebrates while 95% are invertebrates. More than half of invertebrates are insects.
"Insects are the most diverse group of organisms on the planet, but their species diversity is vastly under described," said City College of New York biology graduate student, Connor French.
French and his collaborators constructed the first global map of insect genetic diversity using data from the Barcode of Life database. For animals, including insects, a measurement of genetic diversity within any species can be calculated using a 650 base pair region on the mitochondrial genome. The study appears in the journal Nature Communications.
French compiled and analyzed 2,415,425 globally distributed and georeferenced mitochondrial DNA sequences to determine the genetic diversities for 98,417 species defined by "operational taxonomic units"—groups of individuals organized by genetic similarity.
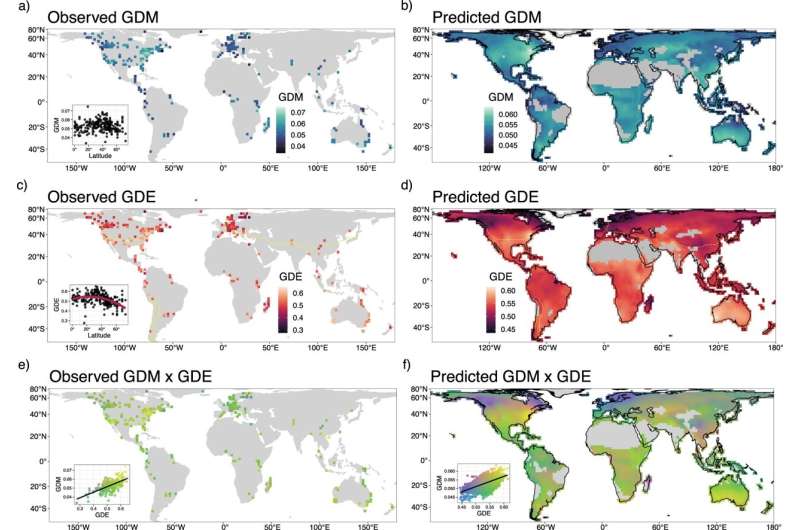
The first global map of insect genetic variation was generated by assessing the average genetic diversity among sampled species in an area, genetic diversity mean (GDM), and genetic diversity evenness, (GDE) the degree of uniformity of genetic diversity among individuals sampled in the same area.
Calculating the two measures across all the taxa studied revealed how GDM and GDE correlate with global environmental and geographic variables.
Regions with high GDM and high GDE (above the 90th percentile) were found in eastern North America, southern South America, southern Africa and southwestern Australia. Areas with the lowest values were located in northern North America and Europe. However, not all values were uniform. Significantly higher GDE values were observed in areas that do not freeze, a finding that did not hold with GDM. Both measurements were lower in the colder regions of the world.
"This study uses the largest global genetic dataset ever assembled [to study genetic diversity]," said French's advisor and senior principal author on the paper, CCNY Professor of Biology Michael Hickerson. The study is a landmark first step in uncovering fundamental processes that drive global patterns of genetic diversity.
More information: Connor M. French et al, Global determinants of insect mitochondrial genetic diversity, Nature Communications (2023). DOI: 10.1038/s41467-023-40936-0
Journal information: Nature Communications
Provided by The City University of New York


