This article has been reviewed according to Science X's editorial process and policies. Editors have highlighted the following attributes while ensuring the content's credibility:
fact-checked
peer-reviewed publication
trusted source
proofread
Predicting regional organic carbon in deep soils

Field sampling combined with laboratory analysis is the most commonly used approach to obtain deep soil organic carbon (SOC) data and has been widely applied for more than a century. This approach provides the most accurate measurement of deep SOC concentration but is highly time-consuming and labor-intensive and is not practical at large spatial scales.
Alternatively, developing mathematical functions to predict SOC in deep soils offers a quick technique for regional assessment. The depth distribution function describing the vertical distribution of SOC with soil depth has been used to estimate the deep SOC concentration in various regions and ecosystems. This method requires SOC data collected from multiple layers with a depth of at least 100 cm to obtain the parameters of the function.

Additionally, the fittings among various functions have been rarely compared, leading to large arbitrariness in selecting the depth distribution function and lower fit goodness of selected function for the measured data. Moreover, application of such method is mainly focused at the site scale. These drawbacks of the currently used approaches restrict the accurate estimation of deep soil SOC at regional or larger spatial scales.
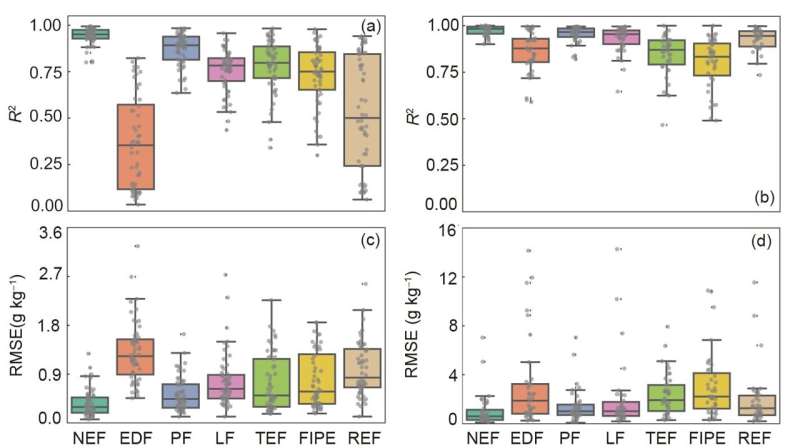
Jingjing Wang et al. composed regional SOC datasets from the measured and International Soil Reference and Information Centre (ISRIC) Soil Information System database. The datasets were used to compare the results of the currently used 7 depth distribution functions in fitting the vertical distribution patterns of SOC to select the optimal depth distribution function. Then, the team developed a prediction approach of deep SOC at the regional scale, through analyzed the relationships of the optimal depth distribution function parameters and soil properties from 0-40 cm topsoil layers.

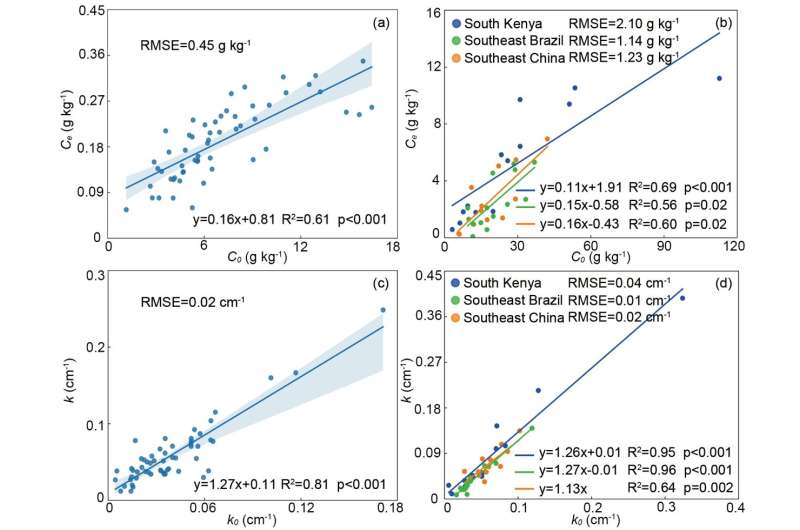
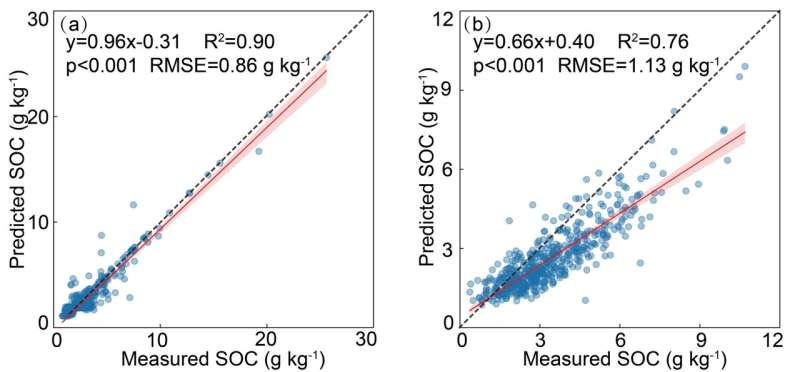
The team demonstrated that the negative exponential function can effectively simulate the SOC vertical distribution pattern along soil profiles in different regions, the parameters (i.e., Ce and k) in the negative exponential function was linearly correlated with SOC in topsoils (0-40 cm) at the regional scale. Combining the negative exponential function and the parameters derived from the above linear prediction relationships, the authors developed a quick approach to predict SOC concentration in deep soils (down to 500 cm) at the regional scale.
This approach was demonstrated to perform well in predicting SOC in deep soils in various regions. The work is published in the journal Science China Earth Sciences.
More information: Jingjing Wang et al, An empirical approach to predict regional organic carbon in deep soils, Science China Earth Sciences (2023). DOI: 10.1007/s11430-022-1032-2
Journal information: Science China Earth Sciences
Provided by Science China Press


