This article has been reviewed according to Science X's editorial process and policies. Editors have highlighted the following attributes while ensuring the content's credibility:
fact-checked
trusted source
proofread
Global variations in critical drought thresholds that impact vegetation

In a new study, a group from Peking University, China, present a highly novel data-led method that identifies, at all locations, the onset and extent of vegetation suppression for increasing levels of drought.
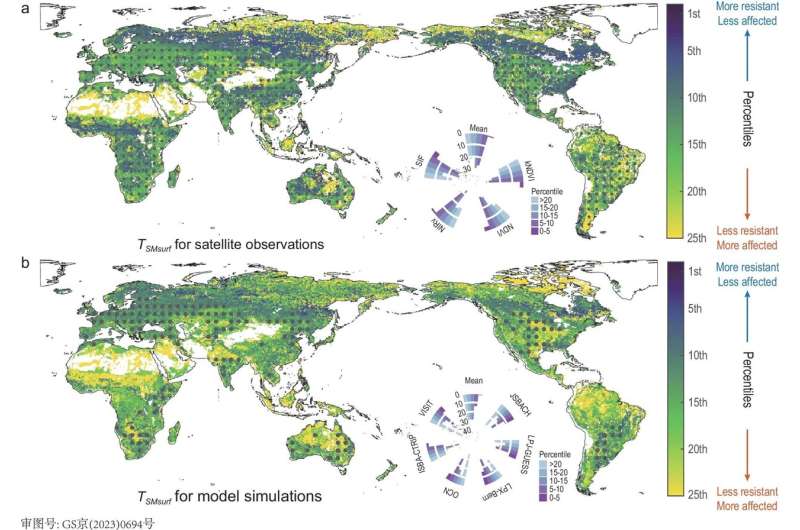
The drought threshold at which damage starts to occur is identified from simultaneous data streams of both soil moisture content and satellite measurements of plant and tree "greenness." Specifically, vegetation lushness during the growing period is based on the Normalized Difference Vegetation Index (NDVI], the kernel NDVI, the near-infrared reflectance of vegetation (NIRv) and solar-induced chlorophyll fluorescence (SIF), which are the measures of vegetation greenness and productivity.
The researchers find vegetation behaves nonlinearly as soil moisture stress rises. A discovery is made of an inflection point that clearly delimits two distinct phases of the response of vegetation growth to increasing drought stress. The first phase is characterized as where vegetation is stable, and resilient to soil moisture fluctuations due to plentiful soil moisture. In the second phase, vegetation growth rapidly decreases as drought intensifies.
"Using our framework, we detect well-defined thresholds of soil moisture beyond which vegetation changes from highly resilient to highly vulnerable as soil water stress intensifies" Dr. Xiangyi Li, first author of this work, says.
The team show drought thresholds vary geographically, with more forested areas having lower thresholds, making them less sensitive to any emerging drought than less forested regions. The threshold representation, based purely on data, reveals that even state-of-the-art vegetation models often fail to describe the extent to which drought can lower vegetation health.
Conversely, current models are overly sensitive to imposed drought conditions for some humid areas with high forest cover. "Our data-driven parameter-sparse representation of drought impacts is a much-needed way to benchmark ecological models," adds Xiangyi.
Arguably the physical components of climate models have been developed over a longer period and are more reliable. Hence the researchers merge estimates of future meteorological change, including drought, with their observationally constrained descriptions of vegetation response to water stress.
This combining of lines of evidence reveals hotspots of East Asia, Europe, Amazon, southern Australia, eastern and southern Africa where the risk of drought-induced vegetation damage will increase substantially by the end of 21st Century and for a "business-as-usual" emissions scenario.
The paper is published in the journal National Science Review.
More information: Xiangyi Li et al, Global variations in critical drought thresholds that impact vegetation, National Science Review (2023). DOI: 10.1093/nsr/nwad049
Provided by Science China Press


