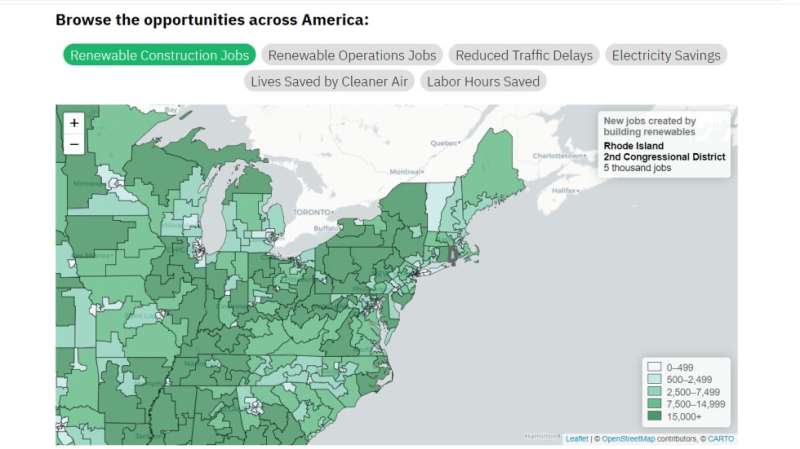
Interactive Climate Opportunity Map shows benefits of future net-zero energy policies

A new interactive Climate Opportunity Map, developed by scholars at Brown University, allows users to enter any United States zip code to learn about what potential benefits await communities if the U.S. were to actively pursue a net-zero energy policy.
The brainchild of Alexander Gard-Murray, a postdoctoral research associate at the Climate Solutions Lab within Brown's Watson Institute for International and Public Affairs, the Climate Opportunity Map draws on publicly available government and academic research data to provide journalists, activists and policymakers with estimates of the benefits individuals and communities could reap if the U.S. pursues decarbonization—including the number of energy jobs a net-zero policy could create, the resulting reductions in commute times and labor hours, and the dollars households and businesses could save on electricity costs.
Gard-Murray said the Climate Opportunity Map could serve as a key tool in shifting the tone of the national conversation about climate change, which is often dominated by doom and gloom.
"Collectively, people working on climate change have spent more time talking about the dangers of inaction and less about the near-term benefits of action," Gard-Murray said. "When I first came to the Watson Institute, I worked with [Climate Solutions Lab Director] Jeff Colgan to publish an evaluation of the federal government's report on the science of climate change. Two things became clear. First, there's been so much focus on the negative impact of the climate change crisis, rather than the benefits of taking action. And second, scientific data were often difficult to access and not locally specific."
Gard-Murray said those lessons drove him to reframe the issue of climate change by creating the Climate Opportunity Map.
The map estimates that—should the country make bold investments in clean energy and other climate solutions—Rhode Island's First Congressional District (in which Brown is located) would see the following gains within the next generation:
- 2,000 new jobs building new renewable energy infrastructure;
- 2,000 new jobs operating new renewable energy infrastructure;
- 1 million hours saved by reducing weather-driven traffic delays;
- an annual savings of $376 on electricity for 206,000 households; and
- six lives saved annually due to cleaner air.
Gard-Murray said the Climate Opportunity Map evaluates data from sources such as the Environmental Protection Agency's 2021 Social Vulnerability Report, Stanford University's 100% Wind, Water and Solar Project, the Global Development Potential Indices project, and other records to predict what could happen in just two decades if the U.S. moves ambitiously on a decarbonization path consistent with the Paris Agreement, an international treaty on climate change adopted in 2015.
Gard-Murray said his goal in creating the map was to make existing science more accessible to those who drive the national conversation on climate change and energy policy.
"On its own, acknowledging the climate crisis has not been enough to get us over the line to act," he said. "Addressing opportunities for change must be part of the discussion. Scientists have done their work on these issues; it's now in the hands of journalists, activists and policymakers to share that progress."
Provided by Brown University


