November 17, 2017 report
NASA develops tool that shows how much sea level rise coastal cities can expect based on location and degree of ice melt

(Phys.org)—A trio of researchers at NASA's Jet Propulsion Laboratory has developed a new tool to map sea level rise for major cities depending on which parts of the Earth's ice sheets melt and by how much. In their paper published on the open access site Science Advances, Eric Larour, Erik Ivins and Surendra Adhikari describe the tool and the ways it can be used.
As the ice at the poles (and on mountain tops) slowly melts due to global warming, sea levels will rise—that much is obvious. Less obvious is how much rise in sea level different cities will actually experience—this is because the Earth spins (and wobbles) and because there are gravitational differences at different points on the planet—some due to the changes in mass of the ice itself. Because of this, it is difficult to say how much a given city will be impacted in the coming years. In this new effort, the team at NASA has made things much easier for city planners. They have created a tool that accounts for all the factors that will impact sea level changes at various points around the globe over time. The end result is that people responsible for long-term planning for cities that exist on or near the sea now have a tool that they can use to see how much sea levels are expected to rise for their city over a given time-frame.
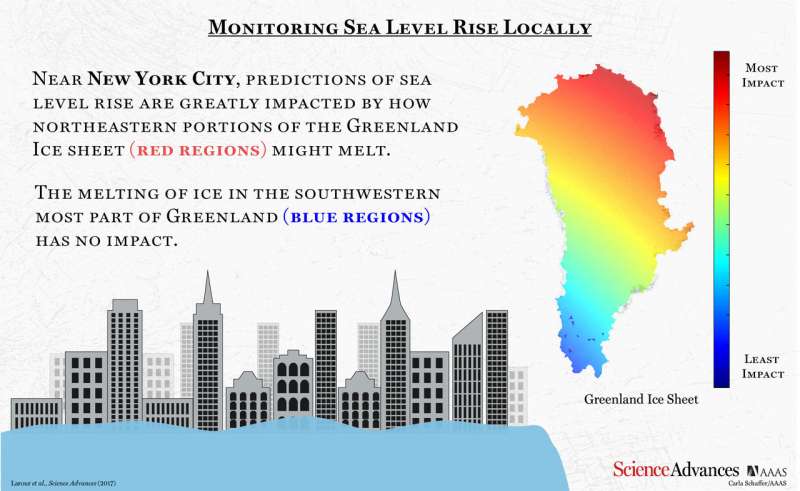
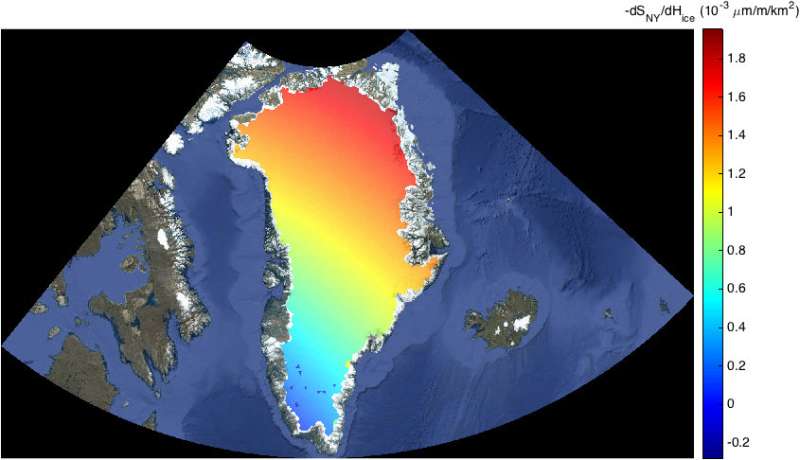
As one example, the tool shows, the researchers report, that ice melting off the northwest corner of Greenland will have a direct impact on sea levels for London over the course of the next century. New York, on the other hand will be much more impacted by ice melting on the whole northern half of Greenland. Moving south, the tool shows that melting of the northern parts of the Antarctic ice sheet will have a profound impact on Sydney, Australia.
The researchers describe their tool as offering a sea-level fingerprint for the planet, one that can be modified as conditions change and more is learned about climate change.

More information: Eric Larour et al. Should coastal planners have concern over where land ice is melting?, Science Advances (2017). DOI: 10.1126/sciadv.1700537
Abstract
There is a general consensus among Earth scientists that melting of land ice greatly contributes to sea-level rise (SLR) and that future warming will exacerbate the risks posed to human civilization. As land ice is lost to the oceans, both the Earth's gravitational and rotational potentials are perturbed, resulting in strong spatial patterns in SLR, termed sea-level fingerprints. We lack robust forecasting models for future ice changes, which diminishes our ability to use these fingerprints to accurately predict local sea-level (LSL) changes. We exploit an advanced mathematical property of adjoint systems and determine the exact gradient of sea-level fingerprints with respect to local variations in the ice thickness of all of the world's ice drainage systems. By exhaustively mapping these fingerprint gradients, we form a new diagnosis tool, henceforth referred to as gradient fingerprint mapping (GFM), that readily allows for improved assessments of future coastal inundation or emergence. We demonstrate that for Antarctica and Greenland, changes in the predictions of inundation at major port cities depend on the location of the drainage system. For example, in London, GFM shows LSL that is significantly affected by changes on the western part of the Greenland Ice Sheet (GrIS), whereas in New York, LSL change predictions are greatly sensitive to changes in the northeastern portions of the GrIS. We apply GFM to 293 major port cities to allow coastal planners to readily calculate LSL change as more reliable predictions of cryospheric mass changes become available.
Journal information: Science Advances
© 2017 Phys.org


