Mapping land claimed by sea level rise

The New Jersey shoreline that sea birds wandered during the last ice age is about 90 miles east of today's beaches, tens of meters beneath the sea floor. As the ice melted, sea level gradually rose and flooded the coastal terrain, and sedimentation carried out its relentless burial of things past.
This summer, a group of scientists spent several weeks aboard the R/V Marcus G. Langseth looking into that past. Using sound waves, they collected data that will be used to build 3D images of the sediment beneath the ocean floor. They hope to be able to peel back layers of the 3D images to see how coastal landscapes responded to rising sea levels and hurricanes through history.
Understanding how coastal areas changed as ocean rose in the past could help communities protect themselves from storm surge flooding in the future as the oceans warm and sea levels rise.
The Langseth, operated by Lamont-Doherty Earth Observatory as the nation's premier marine seismic research facility, collects data about the Earth and oceans in several ways, most prominently through a system of hydrophone streamers towed behind the ship that records sound waves bouncing off structures deep beneath the sea floor. Its seismic mapping capabilities are about to get stronger: The National Science Foundation last week approved the purchase of a new hydrophone streamer system that will reach up to 15 kilometers, allowing the Langseth to capture refracted sound waves and their velocity through sediment layers over a longer distance and wider angle, creating higher-resolution images of deeper features than any research vessel in the world.
. A cutaway shows what 3D seismic mapping can do.")
This summer's New Jersey expedition, led by Rutgers Professor and Lamont Adjunct Senior Research Scientist Greg Mountain, offers a window into the use of hydrophone streamers for reconstructing Earth's physical history, in this case for identifying the impact and magnitude of past sea-level change.
Mountain and his colleagues Mladen Nedimovic of Lamont-Doherty and Dalhousie University and James Austin and Craig Fulthorpe of the University of Texas Institute for Geophysics set out to map past shorelines buried within sediment layers as much as 1,500 meters below the ocean floor. Sediment cores from the area reflect changes in the climate going back about 40 million years. But cores don't provide a view of buried landforms such as barrier islands and inlets, which can show the resilience of coastlines as sea-level changes. Earlier 2D seismic surveys suggested the area holds great potential for understanding shoreline evolution, but the buried features were too fine to see in detail, which could mean the changes that shaped them happened too quickly and were too complex to be imaged with 2D data, Mountain said.
The New Jersey expedition was a technological leap past prior seismic surveys in this region, designed to improve acoustic resolution of ancient seascapes by collecting data in 3D. To do this, the Langseth towed four air guns just below the ocean surface to generate an acoustic pulse with each release of compressed air. Echoes of the pulses reflect off sediment layers a mile or more below the seafloor and are picked up by 24 hydrophone streamers trailed behind the ship, the largest number ever attempted in the research community. Satellite navigation located the position of the ship, each acoustic pulse and the hundreds of hydrophones within those streamers, resulting in roughly 30 million individual acoustic traces over a 200 square-mile area. Mountain and his colleagues expect that the quality and shear density of these acoustic "soundings" of ancient terrains below the seafloor will reveal previously unseen details of how the New Jersey coastline has changed over the last 40-60 million years.
Processing the data into 3D representations will take several months, but once completed, Mountain and his team hope to be able to peel back the sediment layers to reveal the migration of the shoreline as it advanced and retreated. Knowing details such as whether barrier islands in the past were overwhelmed by single storms or cut by inlets as the sea level rose could help scientists find ways to protect and possibly stabilize coastal communities in the future.

"It's in our best interest to understand what happened in the past because it will help explain what we can expect will happen in the future," Mountain said. "We're going to have to make some accommodations for sea-level rise along the coast within our children's lifetime. Sea level along the Jersey shore is likely to be 2.5 to 6 feet higher 100 years from now. With that elevated base, we should expect to see the flooding and destructive equivalent of what now is a once-per-century Superstorm Sandy occur every 5 to 10 years."
The Langseth's new 15 km streamer, purchased from an oil company that had been unable to use it in the current market, will be thinner, lighter and about twice as long as the ship's current streamer. When segmented into shorter streamers, it will be able to create 3D images to show structures such as tsunami-generating faults, the volcanic underpinnings of continental margins, and magma chambers several kilometers below mid-ocean ridges.
Lamont's Office of Marine Operations plans to re-rig the Langseth with the new streamer system this fall. The lighter streamer will also reduce the footprint of the seismic equipment on the ship, creating more room for additional research.
-
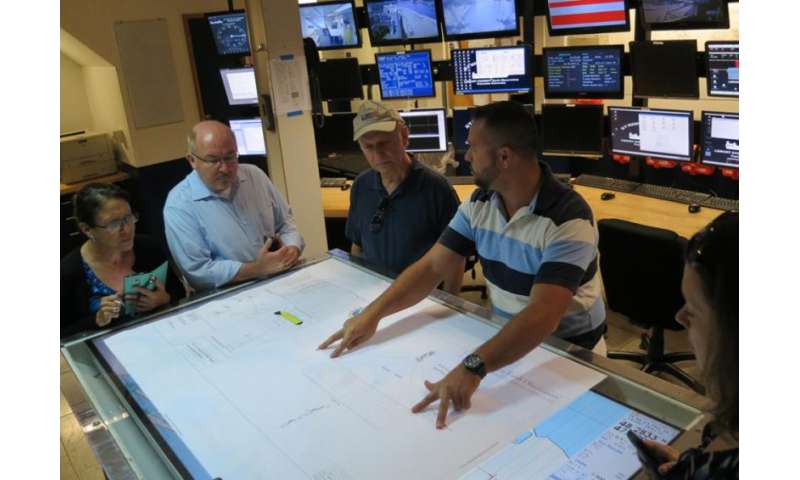
Bobby Kaprowski shows visitors a chart of the seismic streamer system used for a recent survey. -
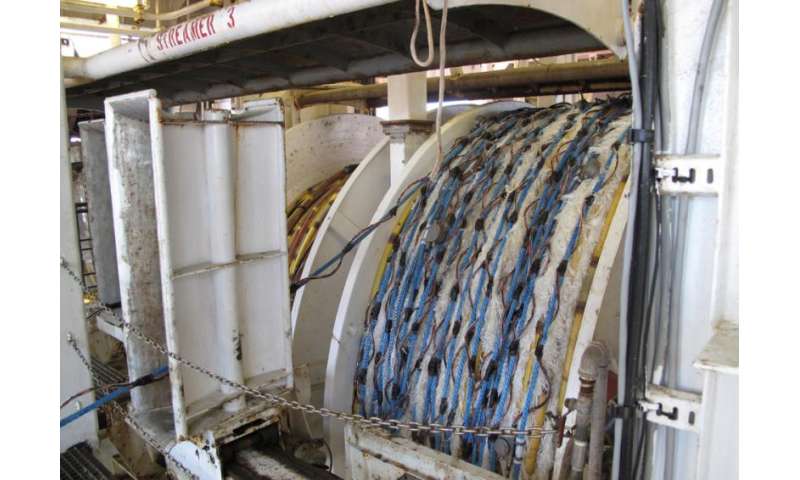
Hydrophone streamers are a key tool for mapping the ocean floor and the sediment beneath it. -
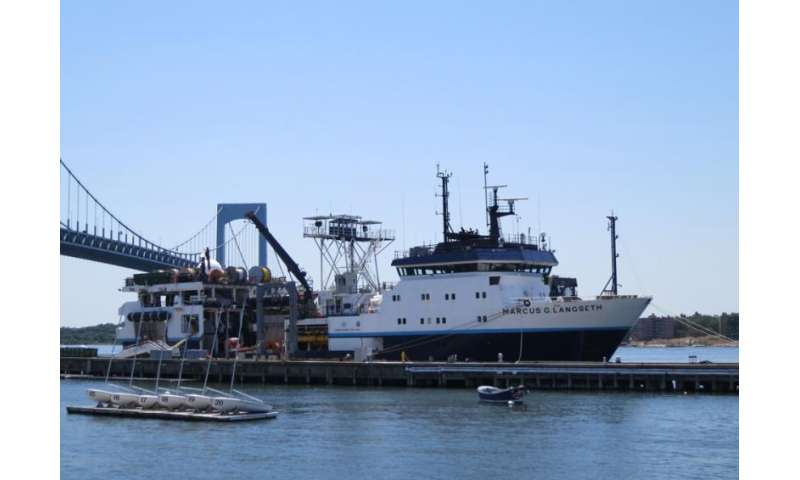
The R/V Marcus G. Langseth
Provided by Columbia University


