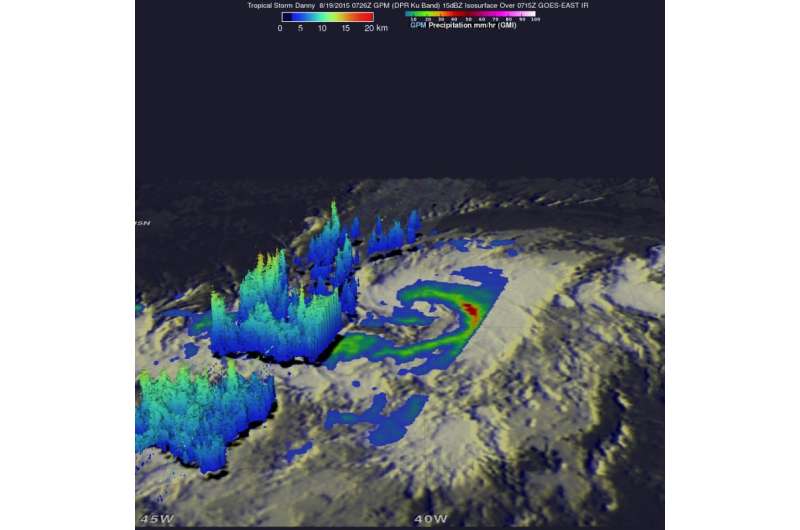
GPM Satellite analyzes Tropical Storm Danny's rain structure

Tropical Storm Danny became the fourth named storm of the season on August 18 when it formed in the central Atlantic about 1,660 miles east of the Windward Islands. The Global Precipitation Measurement (GPM) mission core satellite passed over Danny the next day and analyzed the structure of its rainfall.
Danny originated from an African easterly wave that moved off of the coast of Africa 4 days earlier on the 14th of August. Storms that form in this region are known as Cape Verde storms and typically form towards the height of hurricane season.
In a typical season, there are about 10 named storms and 6 hurricanes. With this year being a potentially strong El Nino year, Atlantic hurricanes are usually suppressed. However, it only takes one. Hurricane Andrew, which devastated south Florida back in 1992, formed during an El Nino. Also, not all El Nino's are alike.
The GPM core satellite is a joint effort. It is managed by both NASA and the Japan Aerospace Exploration Agency.
GPM captured an image of Danny at 07:26 UTC (3:26 am EST) on August 19 and showed rain rates from the GMI overlaid on GOES-East satellite infrared data that showed the extend of Danny's clouds.
At NASA's Goddard Space Flight Center in Greenbelt, Maryland, a 3-D rendering of Danny was made using data from the GPM DPR (Dual-frequency Precipitation Radar). GPM showed that Danny was still in the process of becoming organized. The rain structure was still very asymmetric as noted by a large rain band being located mainly on the eastern side of the storm. Within this rain band, GPM detected rain rates of up to 73.9 mm/hour. At the time of this image, Danny was still a minimal tropical storm with sustained winds estimated at 50 mph by the National Hurricane Center (NHC).
At 5 a.m. EDT (0900 UTC) on August 20, the center of Tropical Storm Danny was located near latitude 12.2 North, longitude 43.7 West. That's about 1,200 miles (1,930 km) east of the Lesser Antilles. Danny was moving toward the west near 10 mph (17 kph). A turn to the west-northwest with no change in forward speed is expected during the next 48 hours.
Maximum sustained winds remain near 50 mph (85 km/h) with higher gusts. Some strengthening is still possible, and the NHC said that Danny could become a hurricane on Friday. The estimated minimum central pressure is 1000 millibars.
Danny is over warm water, and the wind shear is light. Danny is still forecast to become the first hurricane of the Atlantic season within the next day or so and remain a hurricane as it approaches the Windward Islands.
Provided by NASA's Goddard Space Flight Center


