April 28, 2015 feature
It's complicated: Self-organized patterns identify emergent behavior near critical transitions
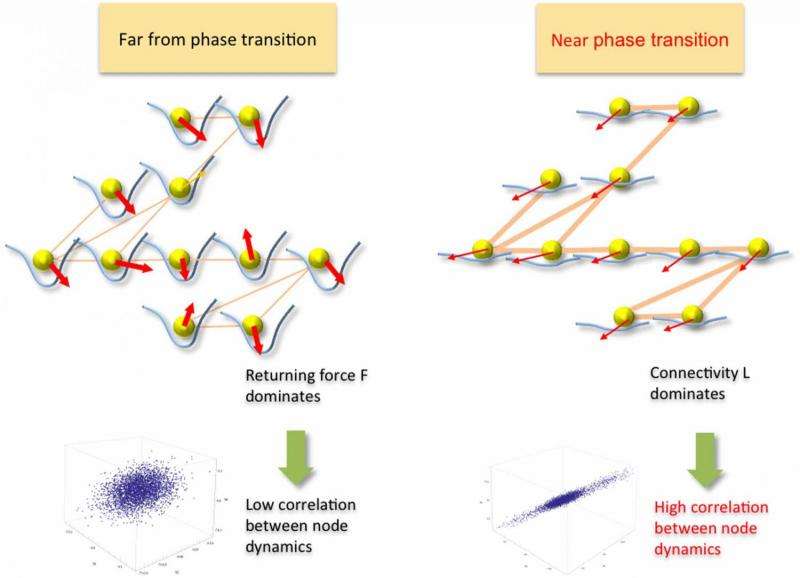
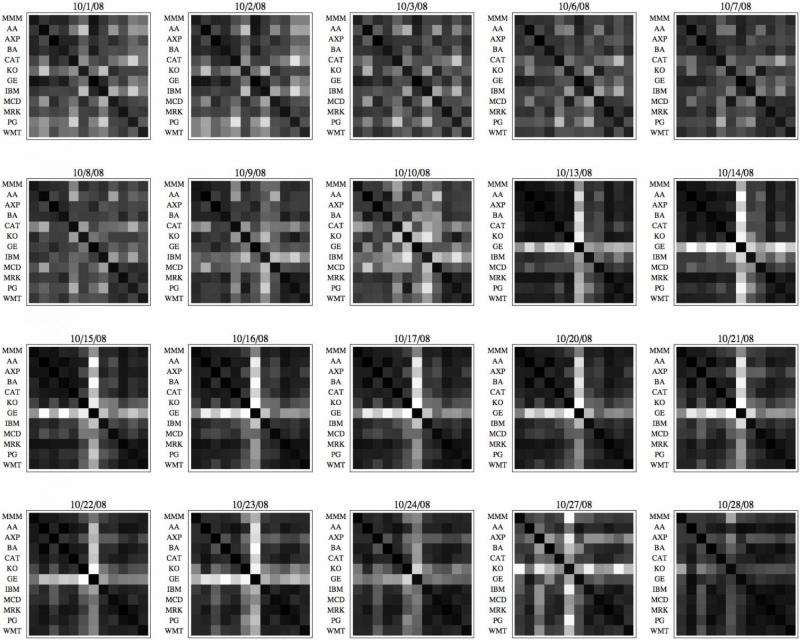
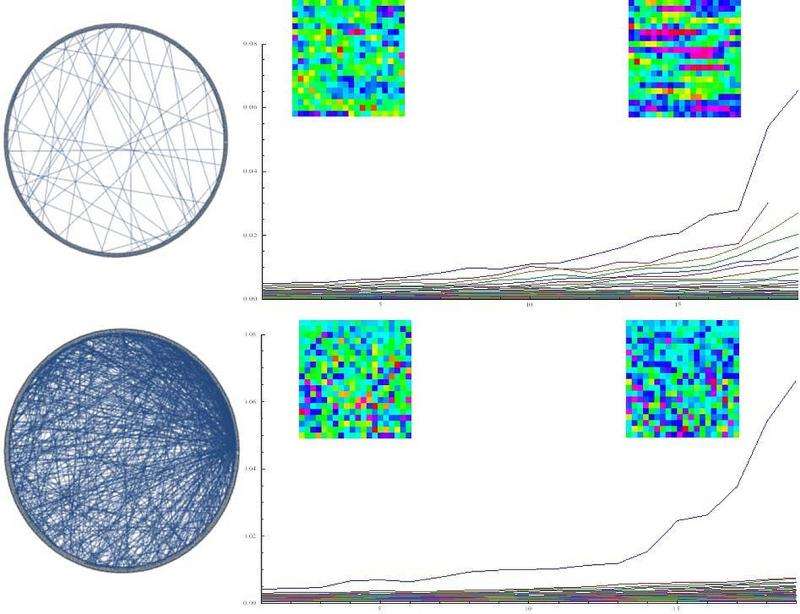
From the perspective of complex systems, a range of events – from chemistry and biology to extreme weather and population ecology – can be viewed as large-scale self-emergent phenomena that occur as a consequence of deteriorating stability. Based on observing the self-organized patterns associated with these phenomena, the elusive goal has been the ability to interpret these emergent patterns to predict the related critical events. Recently, scientists at HRL Laboratories, LLC in Malibu, California sought to determine if there was a quantifiable relationship between these patterns and the network of interactions characterizing the event. By limiting their working definition of self-organization to spontaneous order emergence resulting from a non-equilibrium phase transition (that is, a change in a feature of a physical system – one that is not simply isolated from the rest of the universe –that results in a discrete transition of that system to another state), the researchers were able to detect the transition based on the principal mode of the pattern dynamics, and identify its evolving structure based on the observed patterns. They found that while the pattern is distorted by the network of interactions, its principal mode is invariant to the distortion even when the network constantly evolves. The scientists then validated their analysis on real-world markets and showed common self-organized behavior near critical transitions, such as housing market collapse and stock market crashes, thereby providing a proof-of-concept that their goal of being able to detect critical events before they are in full effect is possible.
Senior Research Staff Scientist Tsai-Ching Lu and Research Staff Scientist Hankyu Moon discussed the paper they published in Scientific Reports. "When applying our method to detect the system's transition based on the principal pattern dynamics mode, we first needed to ensure that the input to our method was a valid observable that served as a surrogate for the phenomena of interest," Lu tells Phys.org. "For example, in our housing and stock market examples, we have well-calibrated, clean, collective signals which are representative of potential behavior manifestations of the systems. However, if we blindly apply our method to extremely noisy and sparse input signals, we'll have a hard time detecting the system's transition due to the still-applicable and fundamental principle of computer science, garbage in, garbage out." In other words, the researchers consider the identification of representative input signals as the main challenge for detecting the system's transition – especially for, exploratory phenomena of interest that are not well-established.
"Our main finding from market data is that extreme and rare events have clear indicative signatures," Moon point out. "For modeling and analysis, this means that when we need a sufficiently long multi-dimensional time series, we have less data to work with." For the stock market data, he illustrates, they had an appropriate number of large-scale historic crashes to work with, and so were able to verify the methodology's goodness-of-fit (which describes how well a statistical model fits a set of observations) – but on the other hand, sufficient historical housing market data were not available.
Another issue, the scientists say, was robustly identifying the system's evolving structure based on observed patterns. "In our simulation and market examples," Lu explains, "we've seen structure amplifications when a system is near its phase transition – but when further away, the ability to make such observations is weaker. We believe this question remains a largely open system identification problem in working with time series signals." More specifically, they see the major challenge as properly defining the sliding window and leap window for capturing the manifestation of pattern-based structural evolution. (In signal processing, a window is a time-series segmentation of a time series signal. A sliding window algorithm is a simple time-series analysis method for isolating and viewing signal segments, in which a small window slides across the time series, one time step at a time; a leap window is a modified sliding window that increases algorithm speed by increasing the value of intersegment transitions.) "Our work on market examples shows the possibility of identifying a system's structure, but it's a small step towards addressing the larger issue."
Moon adds that verifying the structure identification goodness-of-fit is not straightforward. "We were able to verify the structure identification goodness-of-fit through simulation where we know the network connectivity, but in real-world examples the question of how to measure the true connectivity of real-world networks remains an issue."
Relatedly, studying the simultaneous evolution of connectivity and phase transitions was also challenging. "In our study, we showed the possibility of deriving early warning indicators for systems with diffusion dynamics," Lu says. "We expected our method to be generalizable for systems with different dynamics – for example, reaction-diffusion dynamics leading to Turing patterns. One of the major challenges in studying these systems with real-world data is obtaining ground truth labeling" – that is, identifying the absolute truth of the observed data patterns by evaluating input signal fidelity.
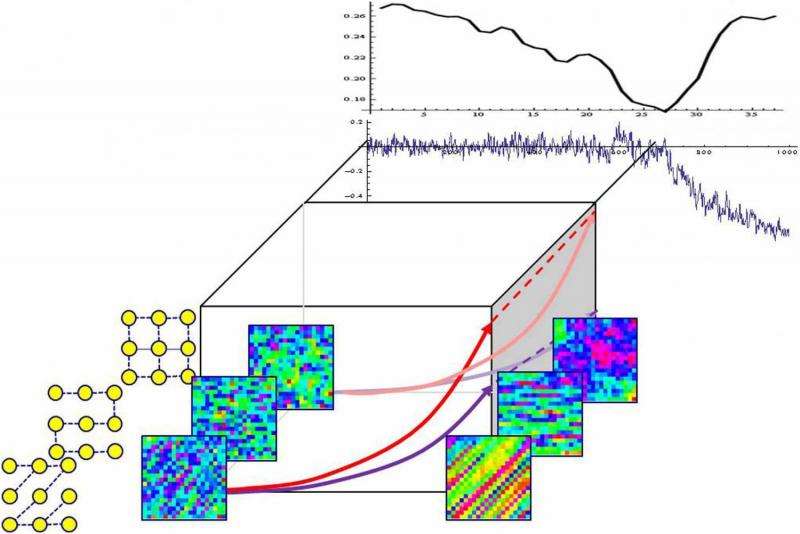
Reaction–diffusion systems are mathematical models which explain how the concentration of one or more substances distributed in space changes under the influence of two processes. Turing processes (named for Alan Turing's theory1, which can be called a reaction–diffusion theory of morphogenesis, the biological process that causes an organism to develop its shape) describe how non-uniformity – natural patterns such as stripes, spots and spirals – may arise naturally out of a homogeneous, uniform state.
"For some phenomena and systems of interest," Lu continues, "critical transitions might be so rare that they would actually prohibit the development and verification of early warning indicators, especially in the setting of simultaneous evolution of connectivity and phase transitions." That being said, he adds that they did obtain some initial results for simulated Turing patterns, which they will proceed to test in real-world datasets.
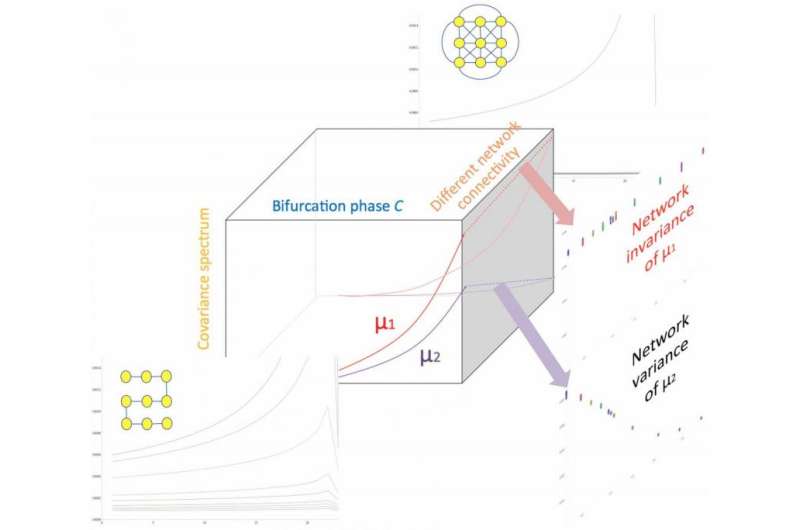
The researchers also had to derive a general indicator of a critical transition that is not affected by its structure. When they began this study, Lu recounts, they set out to develop structure-invariant indicators for heterogeneously networked systems. "The major challenge was in the intricacy of evolving structures and their dynamics. We started with simulations to prove the concept of decoupling network structure from the covariance spectrum, but it took some time to convince ourselves that such an indicator existed." The scientists used covariance – a measure of how changes in one variable are associated with changes in a second variable – to combine evolving dynamics, peer influence, and random perturbation to derive a network of stochastic differential equations. "When we tested these ideas on real-world data," Lu adds, "we started to learn how well our indicators will work for various types of systems."
The final obstacle was mathematically proving that the first eigenvalue (each of a set of values of a parameter for which a differential equation has a nonzero solution under given conditions) of the covariance matrices computed from the time series is a network-invariant indicator of instability. "The major difficulty was in finding the appropriate mathematical tools to capture the linkage – that is, decoupling – of network structure and time series analysis," Lu explains. "Linking spectral graph theory and covariance metrics – the latter in the form of a stochastic differential equation – enabled the proof."
"In addition," Moon notes, "after we empirically verified the invariance, it intuitively made sense. The challenge was to derive the closed-form expression of the covariance statistics eigenvalues using the structure variables Laplacian eigenvalues," in which the number of times 0 appears as an eigenvalue in the Laplacian is the number of connected components in the graph. Moon adds that classical tools by V.I. Arnold2 helped fill the gap.
To address these challenges, Lu relates, they found their key insight in Scheffer's conceptualization3 that critical slowing down phenomena – in which the return time of a disturbance back to equilibrium – increases close to a bifurcation can be quantified by statistical means. "When we thought about networked dynamics, we naturally looked into the co-variance spectrum as it generalizes the correlation and variance measures of Scheffer's setup of homogeneous systems." (A system of linear equations is homogeneous if all of the constant terms are zero.) "Our key innovation lies in identifying structure-invariant and structure-revealing measures, as they allow us to look into systems at various sizes and dimensions."
In addition to the effective early warning signals introduced in the literature3,4,5, Lu tells Phys.org that he and Moon were inspired to investigate the simultaneous evolution of connectivity and phase transitions in several application domains. "In particular, we were fascinated by neural firing patterns in epileptic seizures, cascading failures of electrical power grids, and close-to-chaos operation regions of complex electronics. We see the investigation and analysis of complex network structure and dynamics with data analytics as the key to untangle these and myriad other mysteries."
The study's main finding showed that while the pattern is distorted by the network of interactions, its principal mode is invariant to the distortion even when the network constantly evolves – and Phys.org asked the scientists how this invariance might reflect the neurobiology of perceptual pattern recognition of ecological invariants, as posited by James .J. Gibson in the theory of Ecological Psychology6. "This is a very interesting question," Lu replied. "We may speculate that humans explore such invariant cues to anticipate upcoming transitions. However, individuals may interpret the cues differently; some may go deeper to identify structural-revealing characteristics to optimize and adapt their action relative to critical transitions, while others may simply ignore the signals due to biased beliefs. It's also possible that our brain has been wired to perceive such invariance as we perform perceptual or higher-level cognitive reasoning. There's much to investigate."
"My highly ambitious, yet scientifically unfounded, conjecture," Moon added, "would be that the brain might be performing linear algebra-based spectral analysis to decompose the dynamics and summarize the patterns!"
Phys.org also asked the researchers if – given that their analysis of real-world markets shows common self-organized behavior near critical transitions, and therefore that detection of critical events before they are in full effect is possible, thereby making the question of timescale extrapolation becomes important – they have a sense of the temporal limit on early detection of critical events. "Yes," Lu said, "the timescale extrapolation is very important. As mentioned earlier, our methods depend on the fidelity of the input signals, subject to the data samples within the sliding and leap time windows used for computing the co-variance spectrum – different systems are likely to require different sampling granularity. It would be interesting to explore the theoretical limit for the method to work."
"At a basic level," Moon pointed out, "this can be simply a signal-to-noise ratio problem. For a more rigorous characterization of prediction horizon, we envision that recent developments in Gaussian processes and random matrix theory may help." (Gaussian processes are a family of stochastic processes in which every point in an input space is associated with a normally distributed random variable, while a random matrix is a matrix-valued random variable.)
In their paper, the researchers state that they believe that since increased correlation and pattern dynamics are general behaviors of complex networks, their proposed computational tool should find broader applications. "We see potential applications not only in individual application domains, but even more interestingly in interactions among domains, such as social-technological systems, cyber-physical systems, and neurobiological systems," Lu says. "For example, one may speculate if it is even possible to detect a flash crash triggered by self-organized algorithmic trading."
Regarding the planned next steps in their research, Lu tells Phys.org that they plan to move forward in three main areas: expanding application areas; deepening their understanding of critical transitions, especially for interacting systems; and building data sources, tools, and statistical methods for thorough evaluations of critical transitions. "We'd also like to track and evaluate real-world impacts of decisions based on the early warnings our approach generates – for example, we'd be very interested in finding suitable spatiotemporal data collected from natural systems to test our method, especially datasets related to cancer research – and we hope our research can interest more researchers in studying critical transitions in their fields."
More information: Network Catastrophe: Self-Organized Patterns Reveal both the Instability and the Structure of Complex Networks, Scientific Reports (2015) 5:9450, DOI:10.1038/srep09450
Related:
1The Chemical Basis of Morphogenesis (PDF), Philosophical Transactions of the Royal Society of London (1952) 237(641):37–72, DOI:10.1098/rstb.1952.0012
2Stochastic differential equations: theory and applications, Ludwig Arnold, Krieger Pub Co (May 1992), ISBN-13: 978-0894646355
3Early-warning signals for critical transitions, Nature (2009) 461: 53–59 (2009), DOI:10.1038/nature08227
4Spatial correlation as leading indicator of catastrophic shifts, Theoretical Ecology (2010) 3(3):163–174, DOI:10.1007/s12080-009-0060-6
5Spatial variance and spatial skewness: leading indicators of regime shifts in spatial ecological systems, Theoretical Ecology (2009) 2(1):163–174, DOI:10.1007/s12080-008-0033-1
6The Ecological Approach To Visual Perception (Paperback), James J. Gibson, Psychology Press (1986),
Journal information: Scientific Reports , Nature
© 2015 Phys.org


