NASA's triple examination of Typhoon Dolphin

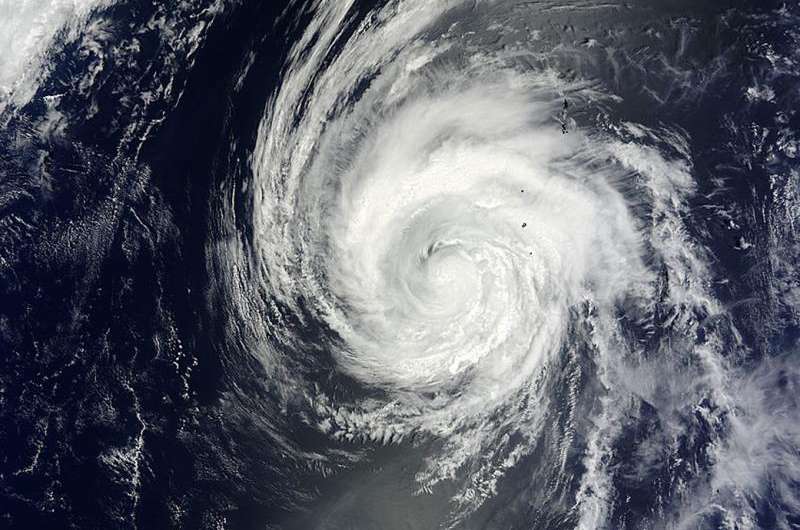
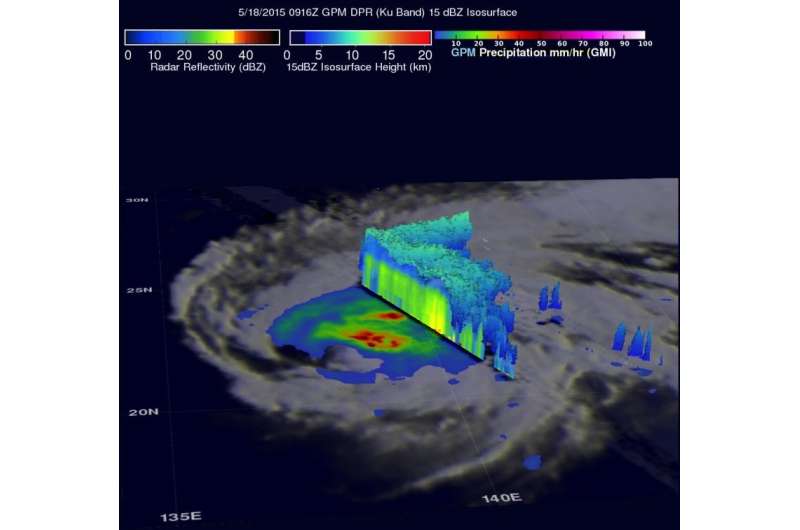
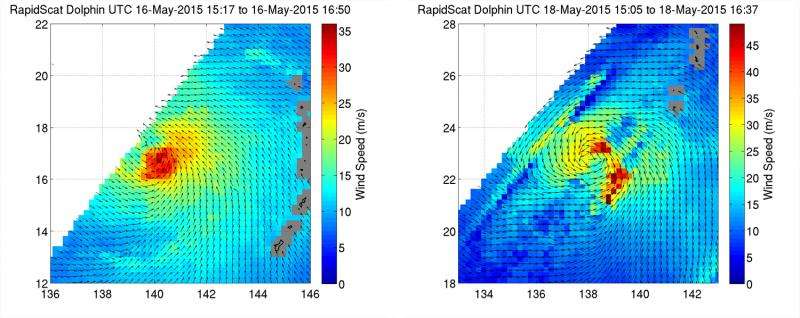
Three different platforms have been examining Typhoon Dolphin as it moves through the Northwestern Pacific Ocean. The RapidScat instrument saw Dolphin's winds intensify over May 16 and 17, the Global Precipitation Measurement or GPM core observatory estimated the drenching rainfall Dolphin dropped over Guam and Rota, and the MODIS instrument aboard NASA's Terra satellite provided a look at the storm's structure as it was passing just west of Iwo To (island), Japan on May 19. Dolphin had weakened to a tropical storm mid-day on May 19 and is becoming extra-tropical.
Typhoon Dolphin battered and drenched the islands of Guam and Rota as it passed over the channel between them on Saturday, May 16.
A rainfall analysis computed from data generated by the Integrated Multi-satellite Retrievals for GPM (IMERG). This analysis showed the total rainfall computed from May 11, 2015 to May 18, 2015 when Typhoon Dolphin was moving through the Marianas. "The heaviest rainfall estimates near Guam and Rota were found to be over 240 mm (almost 10 inches) in channel between the two islands," said Hal Pierce who created the graphic at NASA's Goddard Space Flight Center in Greenbelt, Maryland.
Rota not only received the strongest winds, because of the island was in the right front quadrant of the typhoon but, according to this analysis, also received significantly more rainfall than Guam.
Luckily for Guam, Dolphin's most powerful winds occurred after passing to the northwest of Guam. Those intensifying winds were seen by the RapidScat instrument that flies aboard the International Space Station.

RapidScat obtained two views of Dolphin's surface winds, two days apart. One view of Dolphin occurred at 5 p.m. GMT on Saturday, May 16, and the other at 3:45 p.m. GMT on May 17. "These are almost exactly 48 hours apart and are almost at the same longitude, in agreement with Dolphin having been heading mostly north from Guam to Iwo," said Doug Tyler of NASA's Jet Propulsion Laboratory in Pasadena, California, where the data was converted into imagery. "The most impressive part is how much strength Dolphin gained in 48 hours."
In the RapidScat data from May 16, strongest winds appeared south and east of the center of circulation. Sustained wind speeds were near 35 meters per second (78.2 mph/126 kph). By the May 18 overpass, maximum sustained winds exceeded 45 meters per second (100.7 mph/162 kph) in the northern and eastern quadrants of the storm.
By May 16, 2015 Dolphin had winds estimated at 140 knots (161 mph) making it a category five super typhoon on the Saffir-Simpson hurricane wind scale. That strength didn't last long as the system began interacting with mid-latitude westerly winds.
On May 18 at 09:16 UTC (5:16 a.m. EDT), the GPM core observatory satellite flew above the weakening typhoon when winds had dropped to less than 100 knots (115 mph). GPM's Microwave Imager (GMI) found that Dolphin was dropping rain over the open waters of the Pacific Ocean at a rate of over 65 mm (2.6 inches) per hour.
The MODIS instrument aboard NASA's Terra satellite captured a visible image of Typhoon Dolphin on May 19 at 01:30 UTC (May 18 at 9:30 p.m. EDT) when it was nearing Iwo To island, Japan. Dolphin still maintained a spiral structure with bands of thunderstorms wrapping into the low-level center of circulation. There was no eye visible in the MODIS image, however, as the storm continued to weaken.

At 1500 UTC (11 a.m. EDT), Dolphin's winds dropped to 60 knots (69 mph/1111 kph). It was centered near 26.7 north latitude and 141.9 east longitude, just 68 nautical miles (78 miles/126 km) north-northwest of Iwo To. Dolphin was moving to the northeast at 14 knots (16 mph/26 kph).
Forecasters at the Joint Typhoon Warning Center (JTWC) noted that "animated enhanced infrared satellite imagery continues to show thinning convection as the system is undergoing extra-tropical transition. The system is rapidly merging with a baroclinic zone and will complete extra-tropical transitioning within 12 hours (by 11 p.m. EDT).
The National Oceanic and Atmospheric Administration defines a baroclinic zone as a region in which a temperature gradient exists on a constant pressure surface. Baroclinic zones are favored areas for strengthening and weakening systems; barotropic systems, on the other hand, do not exhibit significant changes in intensity. Also, wind shear is characteristic of a baroclinic zone.
The JTWC noted that it will not issue any later bulletins on Dolphin. Extra-tropical storm Dolphin is expected to move on a northeasterly track over open waters of the Northwestern Pacific Ocean where it is expected to dissipate.
Provided by NASA's Goddard Space Flight Center


