When it comes to variations in crop yield, climate has a big say

What impact will future climate change have on food supply? That depends in part on the extent to which variations in crop yield are attributable to variations in climate. A new report from researchers at the University of Minnesota Institute on the Environment has found that climate variability historically accounts for one-third of yield variability for maize, rice, wheat and soybeans worldwide—the equivalent of 36 million metric tons of food each year. This provides valuable information planners and policy makers can use to target efforts to stabilize farmer income and food supply and so boost food security in a warming world.
- The work was published today in the journal Nature Communications by Deepak Ray, James Gerber, Graham MacDonald and Paul West of IonE's Global Landscapes Initiative.
- The researchers looked at newly available production statistics for maize, rice, wheat and soybean from 13,500 political units around the world between 1979 and 2008, along with precipitation and temperature data. The team used these data to calculate year-to-year fluctuations and estimate how much of the yield variability could be attributed to climate variability.
- About 32 to 39 percent of year-to-year variability for the four crops could be explained by climate variability. This is substantial—the equivalent of 22 million metric tons of maize, 3 million metric tons of rice, 9 million metric tons of wheat, and 2 million metric tons of soybeans per year.
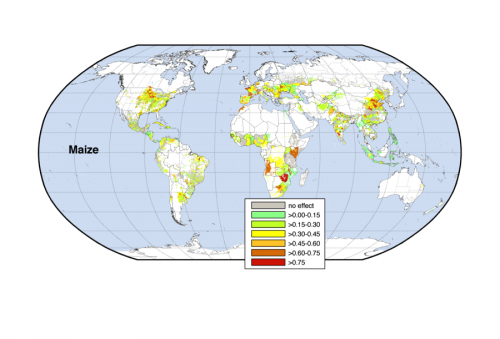
- The links between climate and yield variability differed among regions. Climate variability explained much of yield variability in some of the most productive regions, but far less in low-yielding regions. "This means that really productive areas contribute to food security by having a bumper crop when the weather is favorable but can be hit really hard when the weather is bad and contribute disproportionately to global food insecurity," says Ray. "At the other end of the spectrum, low-yielding regions seem to be more resilient to bad-weather years but don't see big gains when the weather is ideal." Some regions, such as in parts of Asia and Africa, showed little correlation between climate variability and yield variability.
- More than 60 percent of the yield variability can be explained by climate variability in regions that are important producers of major crops, including the Midwestern U.S., the North China Plains, western Europe and Japan.
- Depicted as global maps, the results show where and how much climate variability explains yield variability.
The research team is now looking at historical records to see whether the variability attributable to climate has changed over time—and if so, what aspects of climate are most pertinent.
"Yield variability can be a big problem from both economic and food supply standpoints," Ray said. "The results of this study and our follow-up work can be used to improve food system stability around the world by identifying hot spots of food insecurity today as well as those likely to be exacerbated by climate change in the future."
More information: Nature Communications, www.nature.com/ncomms/2015/150 … full/ncomms6989.html
Journal information: Nature Communications
Provided by University of Minnesota


