Ethnic inequalities mapped across England and Wales
The lives of ethnic minorities across the country have been mapped by experts at The University of Manchester with a new profiler that allows you to explore standards of living in each area of England and Wales.
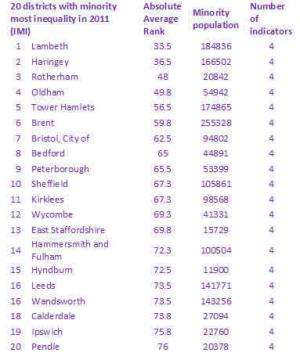
Academics and researchers at the University's Centre on Dynamics of Ethnicity (CoDE) have drilled down into Census data to rank districts by inequality, comparing the experience of minority groups to White British residents living side by side.
CoDE, in collaboration with race equality think thank the Runnymede Trust, has produced measures of ethnic inequalities in education, employment, health and housing for each local authority district in England and Wales, for 2001 and 2011.
The profiler is available for all to use and takes only a few seconds to generate a profile of ethnic inequalities in any chosen area.
Despite Britain continuing to diversify, differences in living standards for minorities and white British residents have remained persistent since 2000, according to the findings of the Local Ethnic Inequalities Area Profiler which launches today (WED). Left alone, the problem will not solve itself, the academics behind it warn.
The project highlights the 20 areas with the most and least inequality between ethnic minorities and White British neighbours and also shows that the problem is not unique to typically diverse urban areas, with more rural areas of Lancashire and East Staffordshire and parts of Kent, Somerset and Lincolnshire showing significant levels of inequality.
Other key findings:
Bradford, where 36% of the population identified connections to an ethnic minority group, stands out as one of the few success stories, managing to bridge the inequalities gap between residents since the turn of the millennium. In education, the number of ethnic minority 16-24-year-olds without qualifications is now in line with the number of white British young adults. This compares to 25% of ethnic minority 16-24-year-olds and 19% of White British in 2001.
In Tower Hamlets, London, 48% of Asian households and 43% of households from ethnic minority groups as a whole lived in overcrowded homes compared with 24% of White British households.
In Breckland, in rural East England, the minority population almost doubled from 5% to 9% between 2001 and 2011. Ethnic inequalities widened on all indicators in that time.
Dr Nissa Finney said: "Ethnic inequalities are not only widespread in England and Wales, they are persistent. These inequalities are not, and will not, disappear of their own accord. This is particularly the case in employment and housing. For example, overcrowding was experienced by ethnic groups in every district over the past decade.
"The findings provide clear evidence that ethnic inequalities are a local concern, and that addressing inequalities is not purely an issue for authorities with diverse and poor populations.
"They also demonstrate that inequalities can be reduced and there are districts across the country that have achieved this over the 2000s."
Dr Omar Khan, director of the Runnymede Trust, said: "This report contains a wealth of information that shows why ethnic inequalities are relevant in every village, town and city in England and Wales. The evidence also suggests that local and national policymakers and decisonmakers must act much more directly to ensure that a third generation doesn't continue to experience disadvantage because of their ethnic background."
Inequality is defined as the difference in the proportion of the White British group and the ethnic minority group who experience disadvantage on a particular indicator. The indicators of inequality used are: percentage aged 16-24 with no qualifications (Education); percentage aged 25 and over who are unemployed (Employment); percentage with a limiting long term illness (indirectly age standardized) (Health); percentage living with an occupancy rating of -1 or below, indicating overcrowding (Housing).
Provided by University of Manchester


