November 30, 2023 feature
This article has been reviewed according to Science X's editorial process and policies. Editors have highlighted the following attributes while ensuring the content's credibility:
fact-checked
peer-reviewed publication
trusted source
proofread
Study identifies the 'fingerprints' of energy models exploring emission mitigation scenarios

Over the past decades, environmental scientists and engineers have been trying to devise effective solutions to reduce greenhouse gas emissions and mitigate the adverse effects of climate change. This has led to the creation of various energy models, frameworks that can be used to investigate emission mitigation scenarios in the hope of meeting the goals outlined by the Paris Agreement.
Some of these energy models are more detailed than others, and their structure, parameters and objectives can vary. When used to estimate what would happen following the introduction of specific climate policies and interventions, the models can thus produce different results.
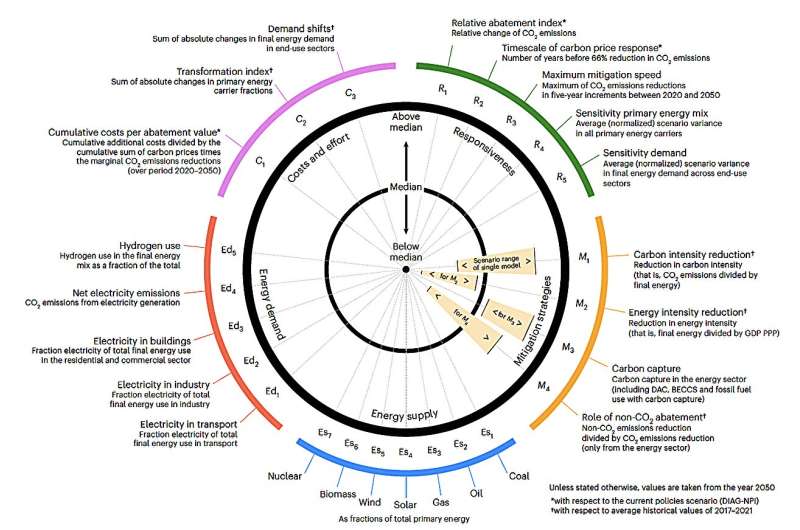
Researchers at PBL Netherlands Environmental Assessment Agency, Utrecht University, and other institutes in Europe recently set out to reliably quantify differences in the results produced by key energy models. Their paper, published in Nature Energy, identifies 'fingerprints' of energy models (diagrams outlining their unique characteristics).
"In many of our research projects, we intentionally include multiple energy modeling teams, because the community is already aware of the importance of different perspectives," Mark Dekker, one of the researchers who carried out the study, told Phys.org. "Model differences can be rather significant in our field and this needs to be spelled out well before interpreting our results."
The recent study by Dekker and his colleagues is part of a broad project dubbed the European Climate and Energy Modeling Forum (ECEMF H2020). The key objective of this project is to inform the development of energy and climate policies that could be implemented throughout Europe or at a national level.
Before they started performing calculations to assess potential pathways for Europe to reach the goal of net-zero emissions, the researchers decided to run a series of diagnostic tests to compare results attained using different energy models. These tests were quite elaborate and time-consuming, yet they yielded interesting results.
"The idea to express diagnostic outcomes in 'diagnostic indicators," some of which originated from two previous papers published in Environmental Research Letters and Technological Forecasting and Social Change," Dekker said.
"The idea to create model 'fingerprints' rather than merely comparing such indicators individually (as done in previous literature) came to me during my own analysis of the results. A unique behavior of a model in one dimension sheds new light on its behavior in another, that is why we aimed to combine many dimensions into one simple framework and ultimately succeeded."
In their tests, Dekker and his colleagues tried to delineate diagnostic indicators of energy models focusing on five key dimensions. These dimensions included a model's responsiveness and its proposed mitigation strategies, as well as its estimated energy supply, energy demand, and mitigation costs/efforts.
"Energy models are crucial to understanding the future of our economy and climate: they give us insights in where our future energy may come from, how it is used and in levers for policy," Dekker explained.
"However, differences between these models make it difficult to navigate through these insights, for both fellow scientists and policymakers. This paper marks an important step in understanding our projections on energy by mapping where each model behaves uniquely and where they agree."
Dekker and his colleagues run their diagnostic tests on eight energy models, which they applied to 10 potential scenarios for the mitigation of greenhouse gas emissions in Europe. These tests allowed them to create 'fingerprints' for these models, which are essentially diagrams that uniquely represent them, similarly to how fingerprints or DNA uniquely identify human beings.
"The most important practical implication of our study is that people can now place modeling studies in context, especially the ones that rely on only a single model," Dekker said. "That model's bias or behavior is now spelled out in relation to other models. For example, the model can be usually projecting more renewable energy that other models, which is important to know when reading its projections on renewables."
The work by this team of researchers could guide future studies that compare the predictions of different energy models or try to contextualize their estimates. Collectively, these research efforts could help to better predict the outcomes of climate policies and energy-related interventions, which could in turn inform the work of the EU commission and other European policymakers.
"We are currently investigating the role of model differences in general and how we can find structures in the large scenario databases, which may sometimes come across as 'spaghetti' for a general user," Dekker added. "Categorizing our scenario into groups of scenarios that each tells a different story can help understand the future of energy and climate better."
More information: Mark M. Dekker et al, Identifying energy model fingerprints in mitigation scenarios, Nature Energy (2023). DOI: 10.1038/s41560-023-01399-1
Journal information: Environmental Research Letters , Nature Energy
© 2023 Science X Network


