Mapping the world's food production footprint on climate and environment

By the time the food we eat gets to our tables, it has traveled a long way—from production, processing and distribution to all of us consumers.
"The food system is the biggest threat to biological diversity and one of the worst drivers of the climate crisis," says Daniel Moran, a researcher at the Norwegian University of Science and Technology's (NTNU) Department of Energy and Process Engineering.
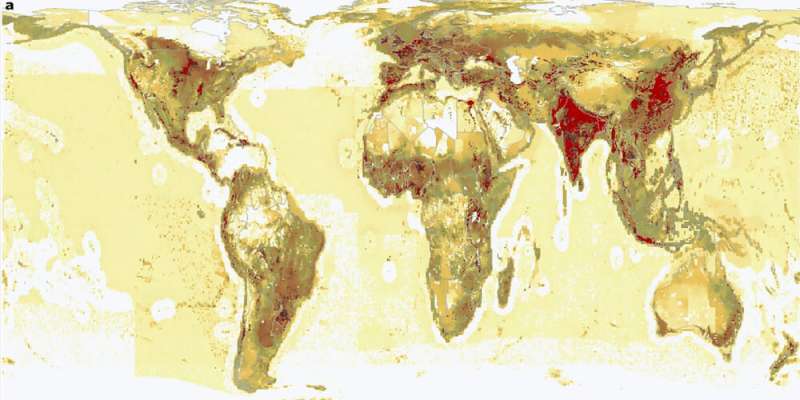
Moran was one of the co-authors of a large study that has produced digital maps showing the pressure that the global food system exerts on the environment and climate.
"No one has done this before, and the mapping has been a gigantic task," the researcher says. Moran collaborated with 16 researchers, including from the University of Leeds and the University of California, Santa Barbara.
More environmentally efficient
"There are lots of different foods on the planet and numerous ways to produce them. The environmental consequences are manifold and difficult to calculate. By gaining a better understanding of the negative impacts, we can achieve more environmentally efficient food production. Doing this will protect the environment and help ensure that we have enough food for the world's population," says Moran.
When the researcher uses the word efficiency, he is referring to the least possible environmental impact per kilogram of food produced. Moran's contribution to the study has been to map the environmental impact that international trade causes.
The five worst offenders
The study shows that five countries—China, India, the U.S., Brazil and Pakistan—account for almost half of the global environmental impact from food production. The researchers have not "crowned" the countries with the smallest environmental footprint for a simple reason: these are poor countries that live with food shortages and hunger.
The researchers have obtained data on 99 percent of all food production in water and on land that was reported in 2017. Unique to this study is that the research group has considered the main types of pressure that food production exerts on the environment: CO2 emissions, water consumption, destruction of habitats and pollution.
They have also followed the entire "life cycle" of the food—from sowing the grain and birth of the piglet all the way to the bread and bacon on the consumer's table—to determine the total environmental impact. Soil depletion, pesticides, toxin runoff, animal feed, irrigation, diesel for transport and emissions from fertilizer production—everything is included in their big environmental calculation.
Lots of food miles
Mapping the "travel kilometers" of the food is not easy.
A frozen pizza can have ingredients from several countries. Denmark, which exports pork in a big way, simultaneously imports pig feed, for example.
The trip from the cow via the dairy to the breakfast table is far from a direct route, either. In some countries, a product as simple as a yogurt might include both imported milk powder and dried fruit.
The study considers the sea, water and land as a whole. Pigs and poultry have a footprint on the marine environment because they eat herring, anchovies and sardines. And in salmon farming, the salmon consume vegetable feed grown on land.
Geographic overview
Using all the collected data, the researchers created a large number of specialized maps that can be combined to study different effects. The maps provide a simple picture that allows almost all the food from different regions to be compared directly.
The study shows that 90 percent of all food production takes place on 10 percent of the world's land area.
Dairy product and beef production takes up 25 percent of agricultural land. Cattle farming has often been portrayed as having the most detrimental environmental impact because it takes up the most grazing land, uses a lot of water and has large methane emissions.
However, the survey shows that farming with pigs poses a greater environmental burden, mostly due to the large amount of resources used to produce feed.
Surprisingly variable
"In general, locally produced food is the most environmentally friendly option, but we were surprised at how much the production footprint of the same product varied in different countries," says Moran.
"A food product can be sustainable when it is produced in one country, but not in another. For example, it turned out that soy production in the U.S. is twice as environmentally efficient as in India."
No super diet
The researchers have not singled out any particular diet as the best one for the environment. The optimal diet can vary greatly from country to country. Moran points out that although local food is often sustainable, people may want to find a balance between their desire to be self-sufficient with all types of food and the most environmentally efficient production possible.
During the COP27 climate meeting in Egypt, Daniel Moran learned that the research project he has been involved with had already been put to use. The Nature Conservancy will use the study to advise global food giants on how to find the most environmentally efficient solutions.
The paper is published in the journal Nature Sustainability.
More information: Benjamin S. Halpern et al, The environmental footprint of global food production, Nature Sustainability (2022). DOI: 10.1038/s41893-022-00965-x
Journal information: Nature Sustainability
Provided by Norwegian University of Science and Technology


