These 5 images show how air pollution changed over Australia's major cities before and after lockdown
")
Have you recently come across photos of cities around the world with clear skies and more visibility?
In an unexpected silver lining to this tragic crisis, urban centres, such as around Wuhan in China, northern Italy and Spain, have recorded a vastly lower concentration of air pollution since confinement measures began to fight the spread of COVID-19.
Likewise, the Himalayas have been visible from northern India for the first time in 30 years.
But what about Australia?
Researchers from the Land and Atmosphere Remote Sensing group at the Physical Technology Center in the Polytechnic University of Valencia—Elena Sánchez García, Itziar Irakulis Loitxate and Luis Guanter—have analysed satellite data from the new Sentinel-5P satellite mission of the Copernicus program of the European Space Agency.
The data shows a big improvement to pollution levels over some of our major cities—but in others, pollution has, perhaps surprisingly, increased.
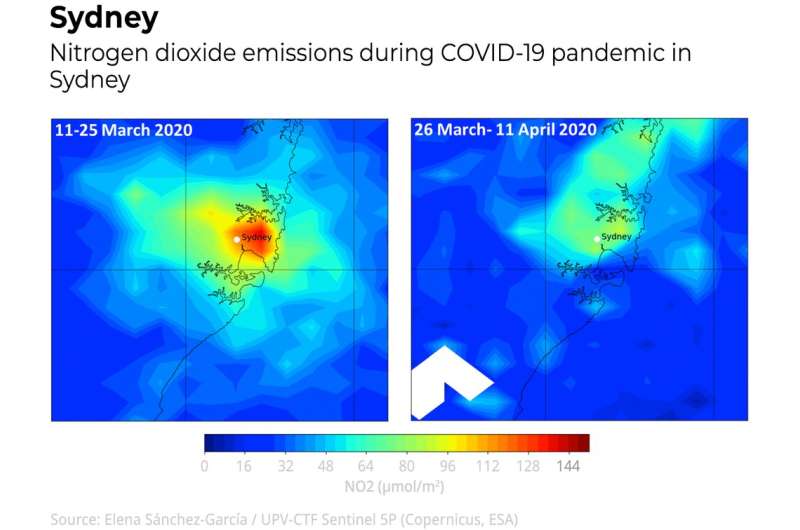
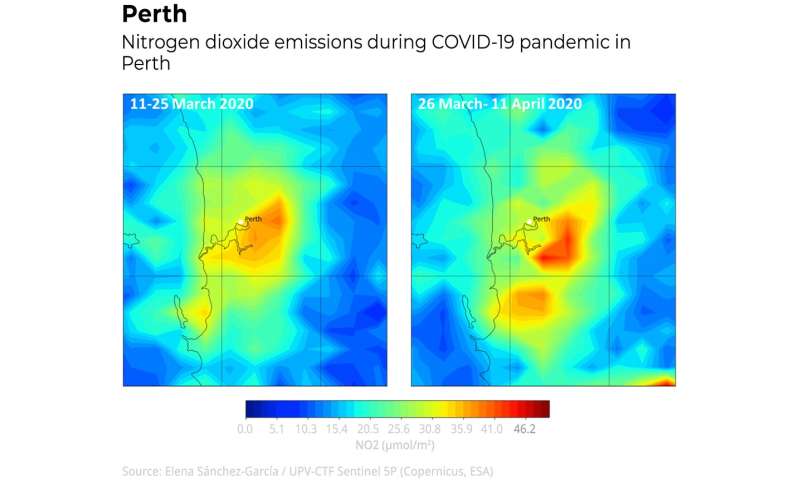
These images measure level of nitrogen dioxide in the atmosphere, an important indicator of air quality. They show changes in nitrogen dioxide concentrations between March 11 to March 25 (before lockdown effectively began) and March 26 to April 11 (after lockdown).
Why nitrogen dioxide?
Nitrogen dioxide in urban air originates from combustion reactions at high temperatures. It's mainly produced from coal in power plants and from vehicles.
High concentrations of this gas can affect the respiratory system and aggravate certain medical conditions, such as asthma. At extreme levels, this gas helps form acid rain.
Declining nitrogen dioxide concentrations across Europe in the northern hemisphere are normally expected around this time—between the end of winter and beginning of spring—due to increased air motion.
But the observed decreases in many metropolises across Europe, India and China since partial and full lockdowns began seem to be unprecedented.
Nitrogen dioxide levels across Australia
Preliminary results of the satellite data analysis are a mixed bag. Some urban centres such as Brisbane and Sydney are indeed showing an expected decrease in nitrogen dioxide concentrations that correlates with the containment measures to fight COVID-19.
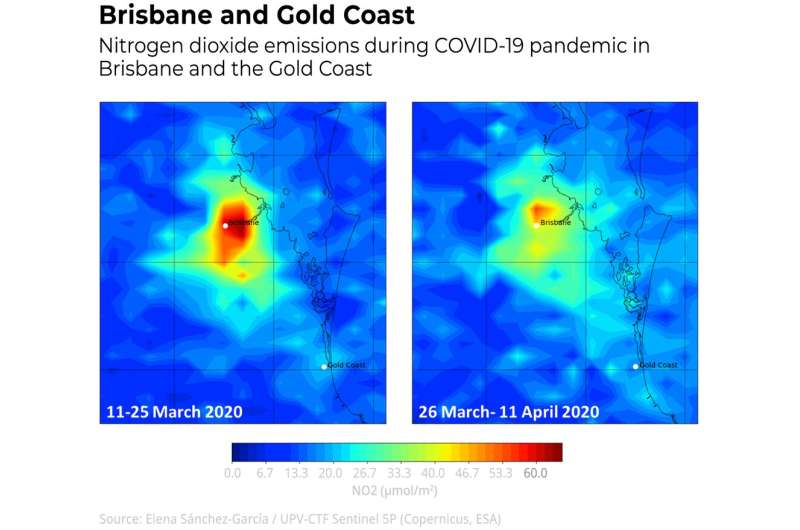
On average, pollution in both cities fell by 30% after the containment measures.
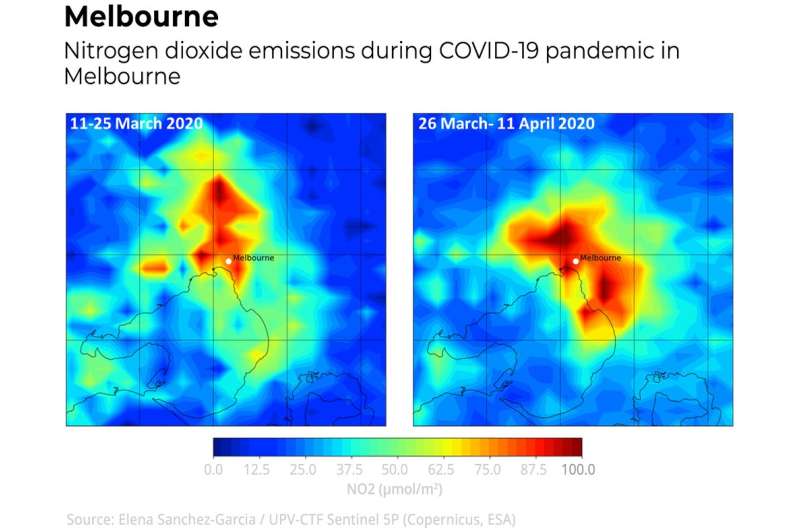
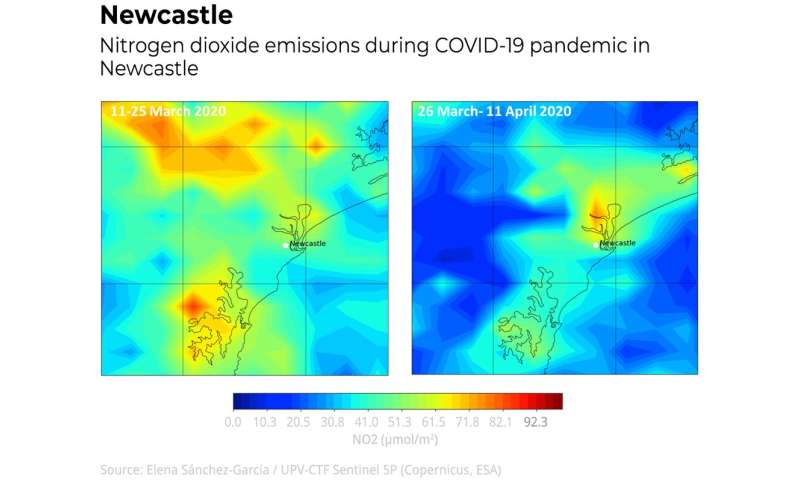
Like a heat map, the red in the images shows a higher concentration of nitrogen dioxide, while the green and yellow show less.
On the other hand, nitrogen dioxide concentrations have actually increased by 20% for Newcastle, the country's largest concentration of coal-burning heavy industry, and by 40% for Melbourne, a sprawling city with a high level of car dependency. Perth does not show a significant change.
We don't know why pollution has increased in these cities across this time period, as 75% of Melbourne's pollution normally comes from vehicle emissions and most people are travelling less.
It could be because the autumn hazard reduction burns have begun in Melbourne. Or it may be due to other human activities, such as more people using electricity and gas while they stay home.
Pollution changes with the weather
Understanding how air pollution changes is challenging, and requires thorough research because of its variable nature.
We know atmospheric conditions, especially strong winds and rain, are a big influence to pollution patterns—wind and rain can scatter pollution, so it's less concentrated.
Other factors, such as the presence of additional gases and particles lingering in the atmosphere—like those resulting from the recent bushfires—also can change air pollution levels, but their persistence and extent aren't clear.
Changes should be permanent
If the decrease in nitrogen dioxide concentration across cities such as Brisbane and Sydney is from containment measures to fight COVID-19, it's important we try to keep pollution from increasing again.
We know air pollution kills. The Australian Institute of Health and Welfare estimates around 3,000 deaths per year in Australia can be attributed to urban air pollution.
Yet, Australia lags on policies to reduce air pollution.
COVID-19 has given us the rare opportunity to empirically observe the positive effects of changing our behaviours and slowing down industry and transport.
But to make it last, we need permanent changes. We can do this by improving public transport to reduce the number of cars on the road; electrifying mass transit; and, most importantly, replacing fossil fuel generation with renewable energy and other low-carbon sources. These changes would bring us immediate health benefits.
Provided by The Conversation
This article is republished from The Conversation under a Creative Commons license. Read the original article.![]()


