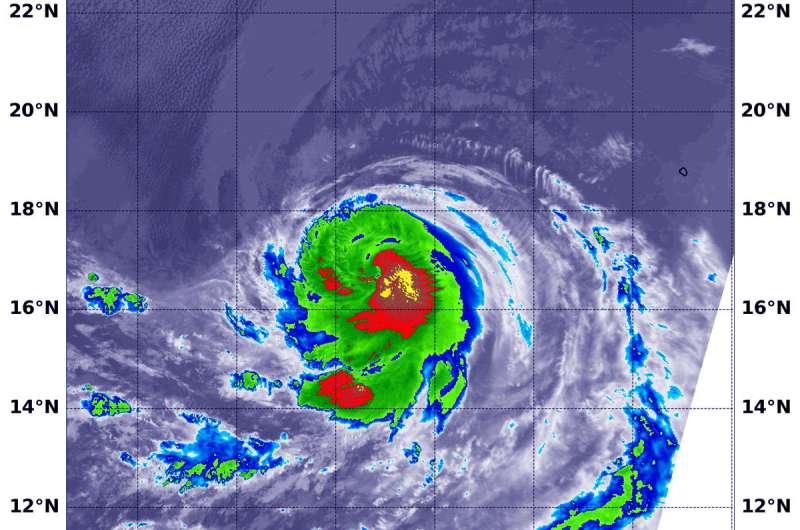
Infrared NASA data shows Hurricane Olivia's strongest sides

NASA's Aqua satellite passed over Hurricane Olivia and found bands of thunderstorms wrapping around its eye and improved thunderstorm development over the southern quadrant of the storm. The eastern quadrant also showed strong storms.
Infrared satellite data at 5:45 a.m. EDT (0945UTC) on Sept. 4, from the Moderate Resolution Imaging Spectroradiometer or MODIS instrument aboard NASA's Aqua satellite showed coldest cloud top temperatures in Olivia in the eastern and southern quadrants. In those areas, cloud tops had temperatures near minus 70 degrees Fahrenheit (minus 56.6 degrees Celsius). NASA research has found that cloud top temperatures that cold have the capability to generate heavy rainfall.
Infrared data also provided forecasters with a look at surrounding sea surface temperatures (SSTs). Tropical cyclones require SSTs at least near 80 degrees Fahrenheit (26.6 degrees Celsius) to maintain strength. NHC forecasters noted at 5 a.m. EDT (0900 UTC) on Sept. 4 that "Olivia has about 24-36 hours or so remaining over warm SSTs with marginally favorable upper wind conditions."
At 5 a.m. EDT (0900 UTC), the National Hurricane Center or NHC noted the center of Hurricane Olivia was located near latitude 16.9 degrees north and longitude 117.2 degrees west. That's about 630 miles (1,015 km) southwest of the southern tip of Baja California, Mexico.
Olivia is moving toward the west near 12 mph (19 kph), and the hurricane is forecast to turn west-northwestward Wednesday with an increase in forward speed.
Maximum sustained winds are near 80 mph (130 kph) with higher gusts. Some strengthening is forecast, and Olivia could become a category 2 hurricane tonight, with gradual weakening commencing early Thursday, Sept. 6.
Provided by NASA's Goddard Space Flight Center


