County-by-county variability of bioenergy crop yields in the U.S.

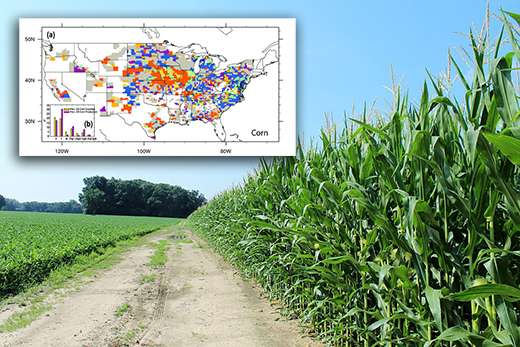
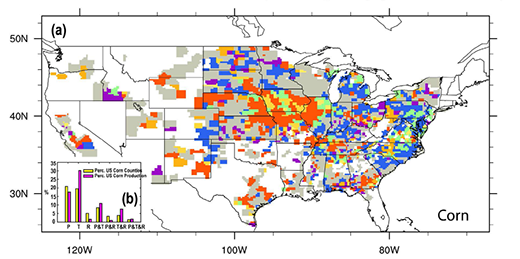
Using corn and soybeans as their testing ground, researchers at Pacific Northwest National Laboratory devised methods to peer into the mechanisms that modulate crop yield variability. They used statistical models to examine how climate variability impacts yields of these popular bioenergy crops at the county level. Among climate factors, the team showed that temperature is predominant in corn-growing counties, both by volume and percentage of production. Precipitation has a similar impact. The amount of energy from the sun, or radiation, has a much smaller effect USA-wide on both soybeans and corn.
To understand the impact of management practices, the research team designed and conducted numerical modeling to reveal how irrigation and fertilization affect crop yield variability. Averaged over the USA, fertilization has a larger impact than irrigation. The work demonstrated that dynamically determining fertilization timing and rates in their models can greatly improve the predictive capability for yields of both crops.
Crop producers are working to up their game to satisfy an increasing demand for energy and food production for more affluent and growing populations. Yet, as any farmer will attest, even the best agricultural practices may be undone by a heat wave or other devastating weather event. Understanding the relative role of climate variability and agricultural practices such as irrigation and fertilization is important for ensuring agricultural and energy sustainability.
"Our data-driven analysis revealed the dominant climate factors in regulating corn and soybean yields variability at the county scale for USA," said Dr. Maoyi Huang, corresponding author and climate modeler at PNNL, "which helped us better understand historical crop yield variabilities."

"Based on observations from various sources, we improved the process-based model's performance and demonstrated the importance of incorporating fertilization approximations in simulating crop yields," said Huang.
The team analyzed county-level yields of corn and soybeans, two popular bioenergy crops, using US Department of Agriculture (USDA) survey data and observed climate. Their aim was to understand how the growing-season (June, July and August) mean temperature (T), precipitation (P), and radiation (R) influence crop yields together and individually at the county scale. In their analyses, they removed the covariability among T, P, and R to investigate the effects of each single climate factor on crop yields. Based on the relative contributions of these different climate variables to the variability of crop yields, they constructed spatial maps on the dominant climate factors.
The team also used models to understand the role of agricultural management on crop yields. Using the Community Land Model over the Conterminous United States, they found that irrigation has limited effects on crop yields compared with fertilization. From this research, the team proposed a prognostic fertilization method by dynamically determining fertilization timing and rates in the model. They showed the new method is more effective than the traditional approach for improving model performance at the county scale.
"By synthesizing observed information from sources such as the US Department of Agriculture and US Geological Survey, our improved process- and observation-based models can help us understand the underlying mechanisms behind crop yield variabilities at the US county scale," said lead author Dr. Guyong Leng, a statistical and numerical modeler at PNNL.
The authors will look at how climate events such as droughts/floods and heat waves/cold spells will evolve in the future and predict how crop yields may react. They will integrate modeling approaches with other analytical and model tools under a multi-scale multi-sector modeling framework to evaluate how ecosystems, hydrology, and social-economic decisions will co-evolve in a changing climate.
More information: Guoyong Leng et al. Simulating county-level crop yields in the Conterminous United States using the Community Land Model: The effects of optimizing irrigation and fertilization, Journal of Advances in Modeling Earth Systems (2016). DOI: 10.1002/2016MS000645
Guoyong Leng et al. The Role of Climate Covariability on Crop Yields in the Conterminous United States, Scientific Reports (2016). DOI: 10.1038/srep33160
Journal information: Scientific Reports
Provided by Pacific Northwest National Laboratory


