First 3-D map of under the East Antarctic sea ice

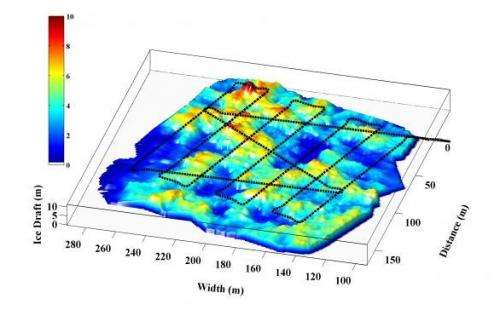
For the first time in East Antarctica, climate scientists have produced a three-dimensional (3-D) map of the surface beneath a sea ice floe, revealing an inverted complex topography evocative of lakes and mountain ranges.
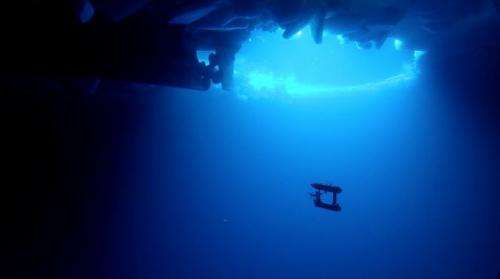
Researchers, on a two-month voyage to the region on the Australian Antarctic Division's icebreaker Aurora Australis, are using an Autonomous Underwater Vehicle (AUV).
This free-swimming robotic submarine is measuring the topography of the underside of the sea ice to learn more about its thickness and volume.
The AUV project leader, Dr Guy Williams from the Antarctic Climate and Ecosystems Cooperative Research Centre, said this technology is a huge step forward in the way scientists measure sea ice thickness.
"In the past we took drill line measurements or observed ice thickness as we moved through it on a ship, but with the AUV we can now use multi-beam sonar to measure an entire ice floe in unprecedented detail," Dr Williams said.
The AUV swims 20 metres below the ice, travelling at about 30 cm per second in a "lawnmower" grid pattern. The data is stored in an onboard computer and converted into a 3-D map at the end of each survey.

AUV research engineer Dr Clay Kunz, from the Woods Hole Oceanographic Institution in the United States, said the robotic submarine is normally used to map the sea floor.
"For this Antarctic mission we mounted all the navigation and scientific instruments on top of the vehicle so they can measure upwards, rather than down," Dr Kunz says.
When the scientists combine the underside of the sea ice with surface measurements of snow and ice, they will have a comprehensive 3-D map of the entire ice floe.
Aerial measurements of sea ice thickness and snow cover are being gathered by Antarctic Climate and Ecosystems Cooperative Research Centre Marine Glaciologist Dr Jan Lieser.
He is using a range of instruments mounted in a Squirrel helicopter, including a high resolution digital camera, a snow radar and a laser scanning system.
Dr Lieser said measuring sea ice thickness and snow cover is the "holy grail" of climate science.
"The thickness of sea ice is regarded amongst climate scientists as one of the crucial indicators of change. When we know how the thickness of sea ice cover is changing over time, we can estimate the influence of global climate change on the Antarctic environment," Dr Lieser says.
Any changes in sea ice thickness will affect the formation of cold, salty Antarctic Bottom Water that drives ocean currents around the world, and the organisms that depend on the ice for habitat and food, from phytoplankton and krill, to whales."
The information gathered on the ice this voyage will be compared with satellite measurements to provide a large-scale view of the amount of sea ice in East Antarctica.
The seven-week Sea Ice Physics and Ecosystem eXperiment (SIPEX-2) voyage – is a continuation and extension of SIPEX-1, which took place in September-October 2007 and is jointly coordinated by the Australian Antarctic Division and the Antarctic Climate and Ecosystems Cooperative Research Centre.
Provided by Australian Antarctic Division


