NASA/Forest Service maps aid fire recovery

New maps of two recent California megafires that combine unique data sets from the U.S. Forest Service and NASA's Jet Propulsion Laboratory in Pasadena, California, are answering some of the urgent questions that follow a huge wildfire: In all the acres of blackened landscape, where are the live trees to provide seed and regrow the forest? Which dead trees could endanger workers rebuilding roads and trails? What habitats have been created for fire-dependent wildlife species?
The maps, so detailed that they show individual trees, cover the areas of two California megafires—the 2013 Rim fire, which burned more than 250,000 acres (1,000 square kilometers) near and in Yosemite National Park, and 2014's very intense King fire near Lake Tahoe—before, during and after the active burns. As the Forest Service directs ongoing recovery and restoration projects in the two areas, it is using the maps to target its efforts toward important goals such as reducing soil erosion and protecting wildlife.
The maps include observations from three instruments: JPL's Airborne Visible/Infrared Imaging Spectrometer (AVIRIS), which collects images in visible light; JPL's MODIS/ASTER Airborne Simulator (MASTER), which observes in thermal infrared—in other words, it "sees" heat; and lidar data showing terrain and canopy with such high resolution that individual trees are outlined.
Carlos Ramirez, program manager of the USFS's Remote Sensing Laboratory, McClellan, California, described three ways the Forest Service is currently using the maps:
— "In some areas of the King fire, you don't see any green for miles and miles," said Ramirez. "It's likely there are not going to be any viable seed sources where the fire was that intense. With the AVIRIS data set, we get an inventory of living vegetation and the condition of it. That gives people in charge of putting together restoration plans an idea of where to focus their attention."
 are at center. Credit: USFS")
— Wildfires increase erosion by burning off plants that stabilize soil and diffuse rain. Intense burns often create a water-resistant layer atop the soil so that rain runs off instead of soaking in, cutting deep channels and increasing flood and landslide danger downstream. The maps identify where trees and plants are still alive and erosion control is not needed.
— Ramirez is working with the University of California, Davis, and nongovernmental organizations to manage the goals of simultaneously clearing hazardous burned timber and preserving habitats for as many species as possible. "Some of these high-severity burn patches are highly desirable habitats," he said. The maps allow the team to better assess habitat quality for species such as the black-backed woodpecker, which thrives on beetles that live in dead trees.

The NASA observations were acquired in the development of a satellite mission called the Hyperspectral Infrared Imager (HyspIRI), which will study Earth's ecosystems and provide critical information on natural disasters. HyspIRI is many years from launch and not yet under construction, but AVIRIS and MASTER are airborne prototypes of its two instruments, developed so that scientists can work out scientific and technological issues in advance. Natasha Stavros of JPL recognized the potential value of the Rim fire observations and began collaborating with Ramirez to assemble the maps. When the King fire broke out, the scientists received additional NASA funding to document that fire and its aftermath as well. They hope to create another set of maps if another California megafire breaks out in 2015.
Scientist Janice Coen of the National Center for Atmospheric Research, Boulder, Colorado, is using the MASTER maps of the King fire in independent research with the Coupled Atmosphere - Wildland Fire Environment model, which simulates the interactions of weather and fires. She hopes to gain insight into why the fire grew so quickly. Fires that intense usually are fanned by high winds, but weather stations around the King fire recorded very little wind when it started. "If you're using the standard tools, you can't explain the rapid fire growth," she said. "The evolution of this fire seems to depend very much on winds the fire itself generated as it burned, and those winds in turn depend on the characteristics of the vegetation the fire had for fuel. It's a good case study, because the new data sets can distinguish between vegetation characteristics that other data sets don't distinguish."
-
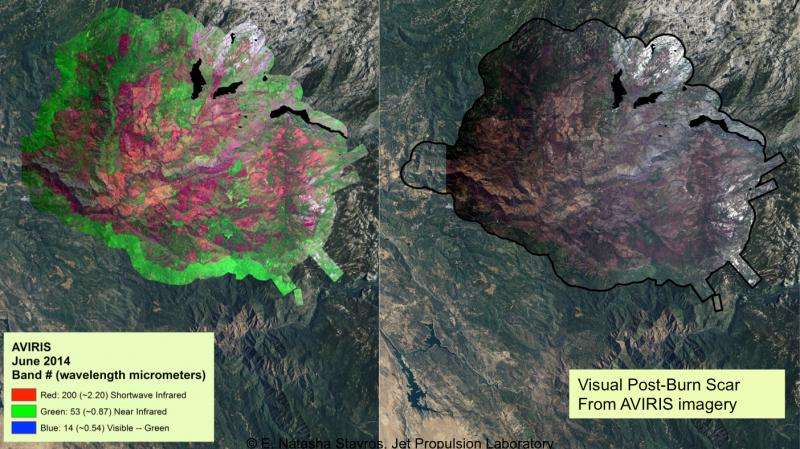
(Left) AVIRIS spectral map of the Rim fire. Charred wood appears red; green foliage is blue. There are no solid blue spots because no large areas remained unburned, but in purple areas, some plants are still alive. The visible-light photo (right) gives far less detail. Credit: NASA/JPL-Caltech -
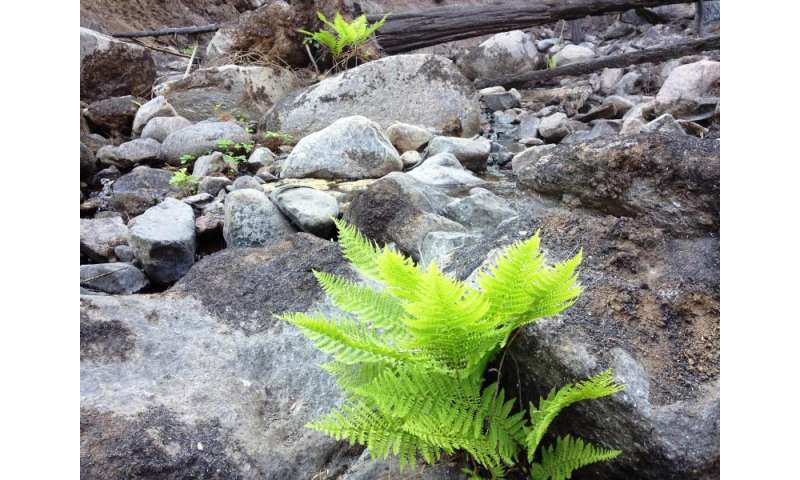
New vegetation growing three weeks after the Rim fire ended. The highly detailed JPL/Forest Service maps can pinpoint pockets of green, which could indicate potential seed sources and wildlife habitats. Credit: USFS/Dorit Buckley -
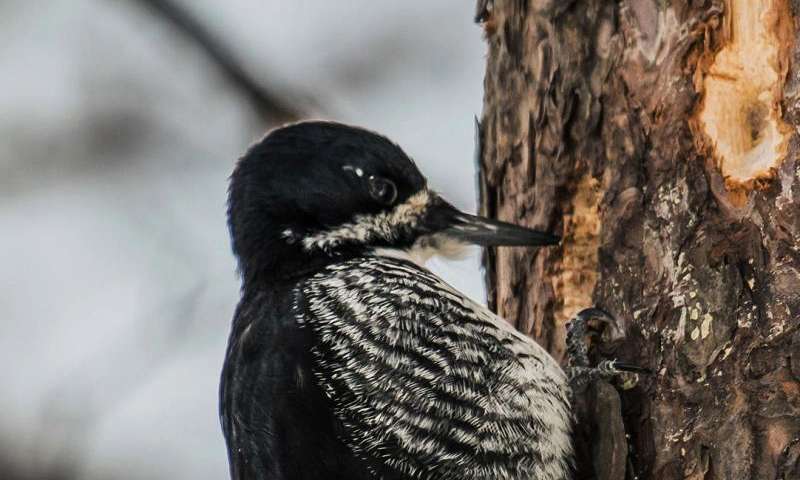
Black-backed woodpeckers are among the species that can thrive on burned woodlands. Credit: Wikimedia Commons -
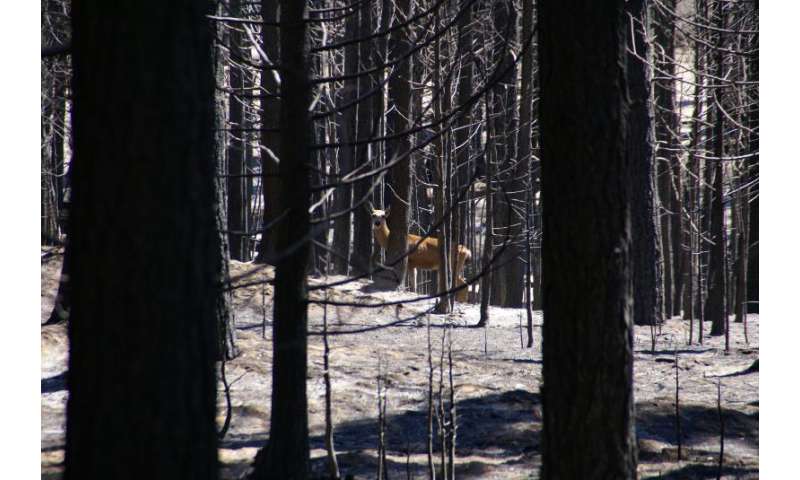
A doe returns to its home range after the Rim fire. Credit: USFS -
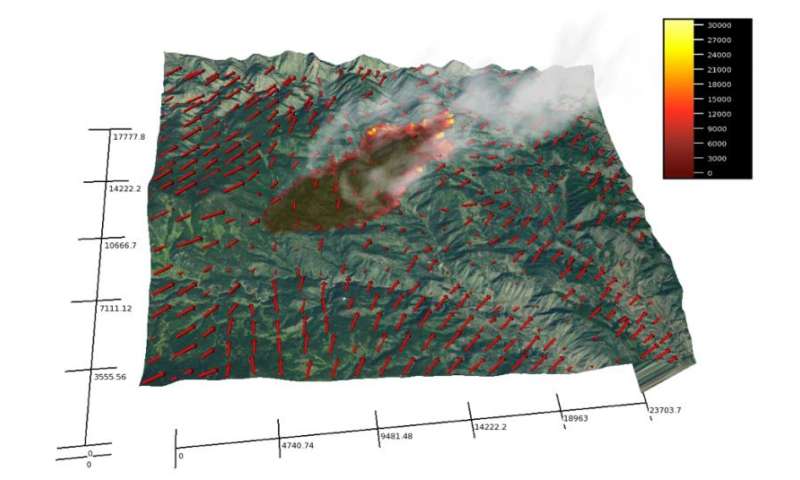
A simulation of a Colorado wildfire by the Coupled Atmosphere-Wildland Fire Environment model. Red arrows show winds. Colors of the burned area show fire intensity. UCAR scientist Janice Coen is using the new maps with the model to gain insight into the behavior of the King fire. Credit: UCAR
More information
A database of detailed maps is online at: wildfire.jpl.nasa.gov/data
Provided by NASA


