World temperature records available via Google Earth
Climate researchers at the University of East Anglia have made the world's temperature records available via Google Earth.
The Climatic Research Unit Temperature Version 4 (CRUTEM4) land-surface air temperature dataset is one of the most widely used records of the climate system.
The new Google Earth format allows users to scroll around the world, zoom in on 6,000 weather stations, and view monthly, seasonal and annual temperature data more easily than ever before.
Users can drill down to see some 20,000 graphs – some of which show temperature records dating back to 1850.
The move is part of an ongoing effort to make data about past climate and climate change as accessible and transparent as possible.
Dr Tim Osborn from UEA's Climatic Research Unit said: "The beauty of using Google Earth is that you can instantly see where the weather stations are, zoom in on specific countries, and see station datasets much more clearly.
"The data itself comes from the latest CRUTEM4 figures, which have been freely available on our website and via the Met Office. But we wanted to make this key temperature dataset as interactive and user-friendly as possible."
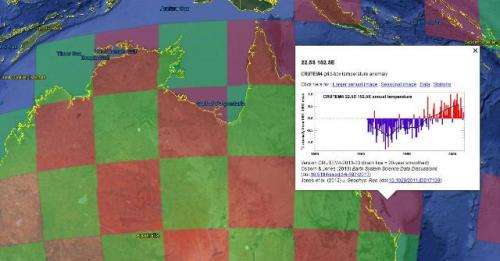
The Google Earth interface shows how the globe has been split into 5° latitude and longitude grid boxes. The boxes are about 550km wide along the Equator, narrowing towards the North and South poles. This red and green checkerboard covers most of the Earth and indicates areas of land where station data are available. Clicking on a grid box reveals the area's annual temperatures, as well as links to more detailed downloadable station data.
But while the new initiative does allow greater accessibility, the research team do expect to find errors.
Dr Osborn said: "This dataset combines monthly records from 6,000 weather stations around the world – some of which date back more than 150 years. That's a lot of data, so we would expect to see a few errors. We very much encourage people to alert us to any records that seem unusual.
"There are some gaps in the grid – this is because there are no weather stations in remote areas such as the Sahara. Users may also spot that the location of some weather stations is not exact. This is because the information we have about the latitude and longitude of each station is limited to 1 decimal place, so the station markers could be a few kilometres from the actual location.
"This isn't a problem scientifically because the temperature records do not depend on the precise location of each station. But it is something which will improve over time as more detailed location information becomes available."
More information: Osborn, T. J. and Jones, P. D.: The CRUTEM4 land-surface air temperature data set: construction, previous versions and dissemination via Google Earth, Earth Syst. Sci. Data, 6, 61-68, DOI: 10.5194/essd-6-61-2014, 2014.
For instructions about accessing and using the CRUTEM Google Earth interface (and to find out more about the project) visit www.cru.uea.ac.uk/cru/data/crutem/ge/.
To view the new Google Earth interface download Google Earth, see www.cru.uea.ac.uk/cru/data/cru … 013-03_gridboxes.kml
Provided by University of East Anglia


