This article has been reviewed according to Science X's editorial process and policies. Editors have highlighted the following attributes while ensuring the content's credibility:
fact-checked
trusted source
proofread
Web-based tool provides insights into disparities in exposure to fine particulate airborne matter

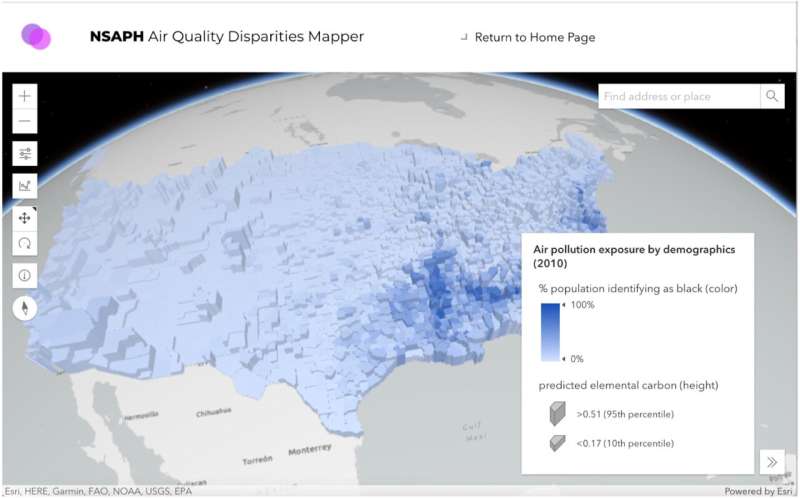
A team of researchers led by the Institute for Climate Change, Environmental Health, and Exposomics at Mount Sinai has developed an innovative web-based tool that provides accessible insights into disparities in exposure to fine particulate airborne matter, known as PM2.5. The work was published in Environmental Modelling & Software on November 20, 2023.
PM2.5 has long been recognized as a significant health concern, with strong links to increased mortality and morbidity. It often disproportionately affects minority and low-income communities.
While existing research has illuminated these disparities, it has largely focused on describing and explaining them. What has been missing is a comprehensive assessment of exposure disparities to the main components of PM2.5 and a means of communicating these disparities in a way that is easily digestible for the general public. Further, PM2.5 composition is location-specific and reduction plans need to account for which emitting sectors are of the highest priority in each area.
The research team's Air Pollution Components Mapper is the first air quality mapper that shows exposure disparities for ambient fine particulate matter composition; it combines high-resolution predictions of PM2.5 components with demographic data from the U.S. decennial census, delivering a powerful visualization of the relationships between exposure and demographic variables.
"This research has far-reaching applications, making air quality data more accessible to the public and informing policy outcomes," said Heresh Amini, Ph.D., MSc, senior author and Associate Professor of Environmental Medicine and Public Health, Icahn School of Medicine at Mount Sinai. "By raising awareness and providing accessible tools for understanding air pollution disparities, this innovation has the potential to drive positive change for affected communities and contribute to a healthier, more equitable future."
Key features of the air quality mapper include:
- High-Resolution Data: The tool uses a 50m x 50m grid to offer fine-grained predictions of PM2.5 components, including elemental carbon, ammonium, nitrate, organic carbon, and sulfate.
- User-Friendly Interface: Leveraging the ArcGIS Javascript API, the mapper is designed for easy interaction, with controls allowing users to modify selected measures and preferred styles of visualization.
- Broad Accessibility: Accessible from any web-enabled device, the mapper is available to a wide audience, making critical information about air pollution disparities more widely available.
To underscore the health concern around PM2.5, the World Health Organization (WHO) updated its guidelines for this harmful pollutant in 2021 to no more than 5 micrograms per cubic meter as an annual average, down from 10 micrograms per cubic meter. Because PM2.5 composition varies depending on the location, the updated WHO guidelines can be difficult to achieve. For example, in New York City, traffic is a major source of PM2.5. In other parts of the country, agricultural activities or organic carbon may contribute more to PM2.5 levels.
The Air Pollution Components Mapper can help communities identify the most relevant sources and components of PM2.5 in their area and facilitate targeted reduction programs to meet the WHO target.
More information: Ethan McFarlin et al, Air quality disparities mapper: An open-source web application for environmental justice, Environmental Modelling & Software (2023). DOI: 10.1016/j.envsoft.2023.105881
Provided by The Mount Sinai Hospital


