This article has been reviewed according to Science X's editorial process and policies. Editors have highlighted the following attributes while ensuring the content's credibility:
fact-checked
peer-reviewed publication
trusted source
proofread
An anisotropic density turbulence model from the sun to 1 au derived from radio observations
 times vs. frequency, FWHM source size (center), source position (right) for fundamental emission. The simulations were performed for turbulence profile multiplied by factors of [1/2, 2] (gray area), and the values of the anisotropy parameter α = [0.19, 0.25, 0.33, 0.42]. Credit: Kontar et al ApJ (2023).")
Density turbulence in the solar corona and solar wind is evident via the properties of solar radio bursts; angular scattering-broadening of extra-solar radio sources observed through the solar atmosphere, and can be measured in-situ in the solar wind. A viable density turbulence model should simultaneously explain all three types of density fluctuation observations.
Solar radio bursts (e.g. Type I, II, III) observed below ~1 GHz are produced predominantly via plasma mechanisms at frequencies that are close to either the local plasma frequency or its double (harmonic), and are thus particularly strongly affected by scattering of radio waves in the corona, so the observed sizes, positions, observed time characteristics are "apparent" and differ substantially from the emission source characteristics.
While this presents a challenge for solar radio observations, it also serves as a unique diagnostic tool to determine how density fluctuations are varying from the sun to 1 au.
-
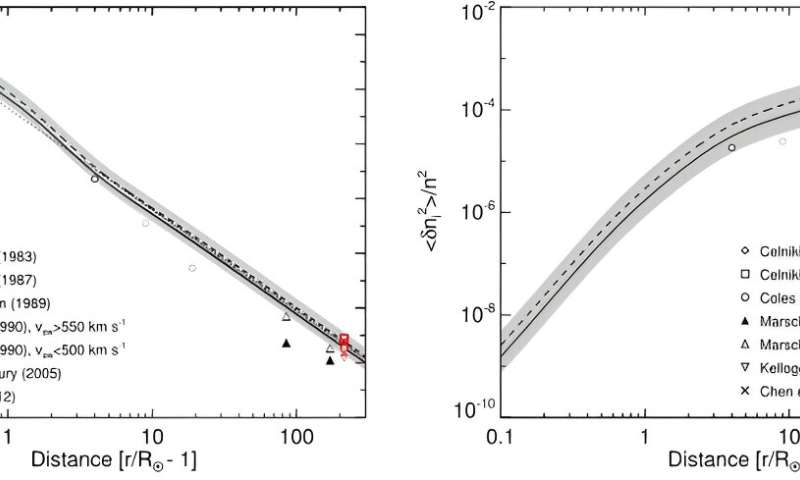
Figure 2: Left: amplitude of the inner-scale density fluctuations used to explain the observations in Figure (1). The gray region denotes the range [1/2,2] as in Figure 1. The dotted line shows the relation <δni2 > = 2 × 10⁷ (r/RSun-1)-3.7. The black and red data points correspond to the assumption of fundamental and harmonic emission, respectively. Right: As in the left panel, but divided by plasma number density n2. Credit: Kontar et al ApJ (2023). -
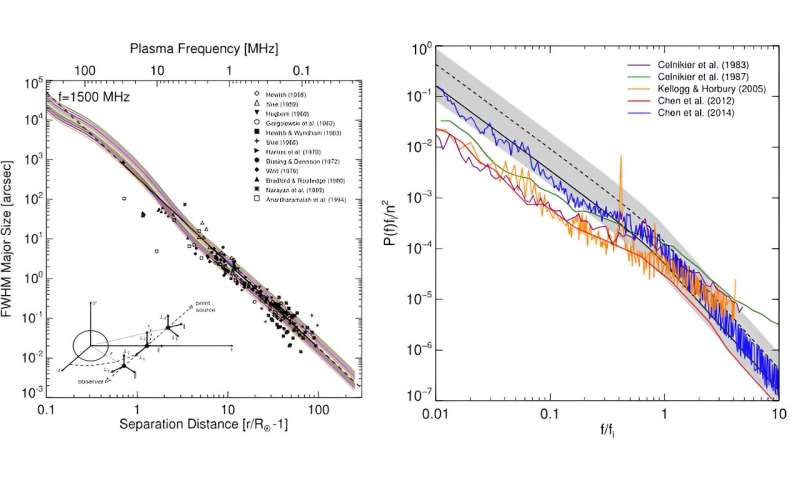
Figure 3: Angular broadening of the radio sources (left) and frequency spectrum of density fluctuations P(f) measured at 1au (right). The gray area is predicted from the density fluctuation model in Figure 2. Credit: Kontar et al ApJ (2023).
In their work that has been published in The Astrophysical Journal, Kontar et al have carried out a large number of radio-wave propagation in turbulent plasma simulations between 0.1 RSun and 1au, and they consider the results in light of the very substantial array of solar observations published in the literature covering the distances from the low corona to 1 au (Figure 1). Comparison of the observations with simulations allows them to deduce the anisotropic density profile (Figure 2).
Solar burst shortest time profiles, source sizes, and positions are determined mainly by propagation effects (mostly anisotropic scattering) and not by the intrinsic properties of the radio emission source.
A detailed knowledge of the scattering process paves the way to disentangling scattering effects from observations and so better constraining the intrinsic properties of solar radio burst sources.
Since individual source sizes and decay times are typically measured more accurately than the spread in measurements of multiple sources, it is therefore likely that the spread in observational properties is due to varying levels of turbulence and plasma density in different events.
Varying the magnitude of the density fluctuations by a factor in the range 0.5–2 covers the majority of the observations, while extending this multiplicative factor by a further factor of two (to a range between 0.25 and 4) covers virtually all observed data points (except for some extreme outliers).
The researchers thus conclude that the density fluctuations at dissipation scale change approximately as <�δni2 > = 2 × 10⁷ (r/RSun-1)-3.7 cm-6 and this quantity is variable within a factor of about two. The broadening of extrasolar point sources by the turbulent solar atmosphere and solar radio burst measurements are complementary data sets (Figure 2).
They note the considerable data gap between ground-based and space-based solar burst observations in the range 3–20 MHz (where extrasolar observations appear essential), and encourage the development of observations to fill this gap and hence further constrain the level of turbulence in the inner heliosphere.
More information: Eduard P. Kontar et al, An Anisotropic Density Turbulence Model from the Sun to 1 au Derived from Radio Observations, The Astrophysical Journal (2023). DOI: 10.3847/1538-4357/acf6c1
phys.org/partners/community-of … r-radio-astronomers/
Journal information: Astrophysical Journal
Provided by Community of European Solar Radio Astronomers


