This article has been reviewed according to Science X's editorial process and policies. Editors have highlighted the following attributes while ensuring the content's credibility:
fact-checked
trusted source
proofread
New analytical tool improves genetic analysis and research accuracy

Rutgers researchers have developed an analytical tool for spotting and omitting stray DNA and RNA that contaminate genetic analyses of single-celled organisms.
Their work, which appears in Nature Computational Science, also may help laboratories avoid mismatching sequenced gene fragments from different organisms in the same sample.
The free software, dubbed Single-cell Analysis of Host-Microbiome Interactions, or SAHMI, can improve the accuracy of medical research—particularly research into the microbiome's effect on health—and may eventually drive clinical care that hinges upon genetic analyses of tissue samples.
"Sample contamination happens frequently because extraneous genetic material is everywhere: flecking off patient fingers, floating through the air, lurking inside the laboratory's reagents," said Bassel Ghaddar, a dual doctoral degree candidate at Rutgers Robert Wood Johnson Medical School and lead author of the study.
"There's also a challenge arising from the algorithms we use to understand where sequenced gene segments come from," Ghaddar added. "They need to figure out whether a bit of DNA or RNA belongs to the patient or a bacterium in the microbiome or an invading virus or something else. And these algorithms can make a lot of mistakes."
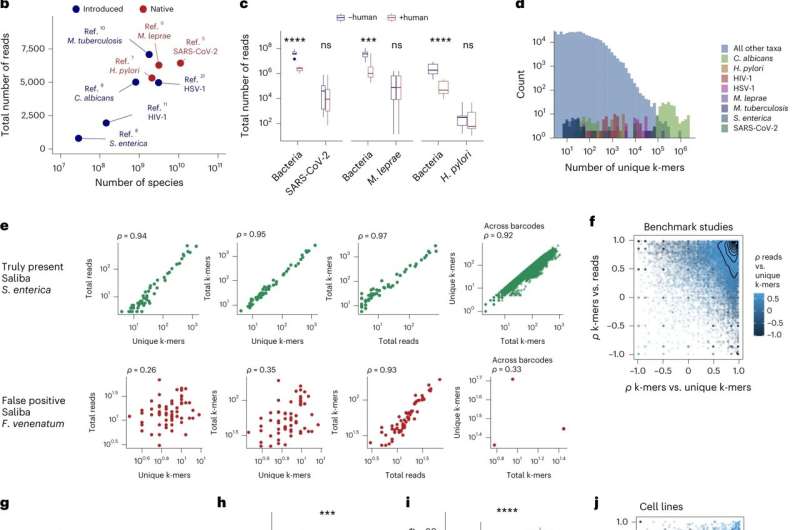
After developing SAHMI, the creators made sure it worked by testing it on various datasets containing samples of human tissues with known microbial infections. They found SAHMI successfully identified and quantified the known pathogens in all the samples while filtering out contaminants and false positives.
The testing also showed that SAHMI could be used to identify microbe-associated cells and to study the spatial distribution of microbes in tissues.
The software's ability to increase result accuracy may improve the study of various tissues and diseases. Ghaddar said it would be particularly valuable in tissue samples that typically harbor a large number of unknown microorganisms.
Such tissue types naturally include those that interact with the gut, skin, nose or lung microbiomes. They include many other tissue types that were once thought to be free of microbes, such as those from organs such as the pancreas and even many cancers.
With that in mind, the creators of SAHMI said it may be used to identify the microbes associated with specific diseases or to track the changes in the microbiome during disease progression. It also could be used to study the effects of drugs or other interventions on the microbiome and the impact of initial microbiome composition on susceptibility to various diseases.
The Rutgers team has already used SAHMI to examine the microbiome of pancreatic tumors and identify particular microorganisms associated with inflammation and poor survival at single-cell resolution. The researchers said they believe microorganisms may be new targets for earlier diagnosis or treatment of pancreatic cancer, the fourth leading cause of cancer death for both men and women in the United States.
"The results this technique produced in our study of pancreatic cancer provided unexpected and important new insight into tumor development while also suggesting new ways to attack tumors," said Subhajyoti De, a principal investigator at Rutgers Cancer Institute and senior author of the study. "We think it could produce similar levels of insight in many other fields of study and ultimately in normal patient care, which is why we're making it freely available via Git Hub."
More information: Bassel Ghaddar et al, Denoising sparse microbial signals from single-cell sequencing of mammalian host tissues, Nature Computational Science (2023). DOI: 10.1038/s43588-023-00507-1
Provided by Rutgers University


