Mobiliscope: Hourly population and social mixing in French and Canadian cities

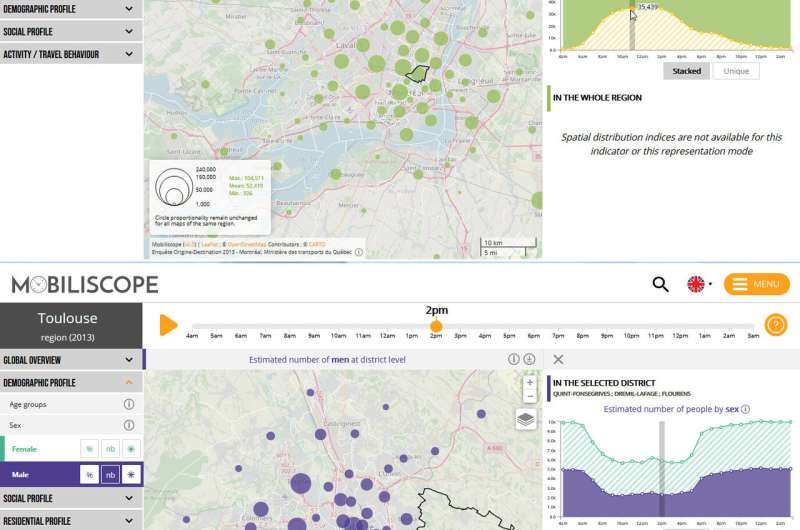
Is this neighborhood more frequented during the day by white or blue collars? By women or men? Which mode of transport is most used to get to the city center during the day? What are the most appropriate public service opening hours for these potential clients? By mapping the demographic and social characteristics of the population on an hour-by-hour basis, the Mobiliscope geovisualisation platform provides answers to these types of questions. A total of 65% of the French population is now covered by the new version, which has been redesigned to meet the needs of those involved in urban planning and mobility. Developed by a CNRS team, Mobiliscope uses data mainly from the Center d'études et d'expertise sur les risques, l'environnement, la mobilité et l'aménagement (Cerema) and is supported by the Agence nationale de la cohésion des territoires.
Through its mapping of the population present in neighborhoods on an hourly basis and by measuring the segregation of towns during the day, Mobiliscope shows that the social composition of a neighborhood cannot be reduced to a profile of the people who spend the night there. Scientists and public actors are able to observe the phenomena of gentrification or impoverishment on a daily basis, which would be invisible if they were limited solely to residential areas, whilst also making the temporalities of public action coincide with those of populations and territories.
Mobiliscope's latest version adds 26 French metropolitan and overseas areas to the previous 23 French and six Canadian city regions. The tool now covers 10,000 French municipalities, in which 65% of the country's population lives, by using and transforming data on the 2,528,000 journeys made by 792,000 people interviewed during large-scale public surveys. In France, these surveys are commissioned by local authorities, approximately every 10 years, and are carried out according to a standardised Cerema methodology (except for the Île-de-France region). Unlike mobile phone data, the surveys provide sociological information (age, sex, socioprofessional category) and also the reasons for travel and the modes of transport used.
Major trends have emerged for all the agglomerations covered by the tool: parity between males and females decreases sharply in neighborhoods during the day, with some areas becoming predominantly female and others predominantly male, in relation to the volume, location and timing of activities (professional and domestic) to which the two sexes are unequally subjected. The social segregation observed at a residential level for every city region is also reproduced during the day, despite (or precisely because of) daily travel: the richest and poorest remain the social groups for which intermingling is lowest during the day, in contrast to the middle classes, which are systematically more dispersed over the territory, during day or night.
In addition to this geographical extension, a major overhaul of the interface and new functionalities now meets the needs of different user profiles: public policy and regional planning specialists, scientists, the world of education and the general public. For example, the new version makes it possible to identify the inhabitants of priority neighborhoods within the urban policy. Another new feature is the OpenStreetMap which makes it easier to find your way around the interactive map and locate public buildings or other facilities (universities, hospitals, business parks, etc.), clarifying the daily rhythms of each region.
Since its inception, this tool has been offered under a free license. Mobiliscope, continuing its commitment to open science, will also make the French datasets collated by the geographers and geomaticians who designed the tool available under an open license.
More information: Visit the Mobiliscope: mobiliscope.cnrs.fr/
Research paper: DOI: 10.5281/zenodo.4549739
Provided by CNRS


