Monitoring trucks and trade from space

Earlier this year, ESA launched a contest asking the general public to submit ideas on how Earth observation data can help mitigate the effects of the COVID-19 pandemic. Today, one of the two winning ideas is being officially released to the public via the "Rapid Action on COVID-19 with Earth Observation" dashboard—a joint initiative from ESA and the European Commission. This citizen-contributed indicator involves an innovative solution for detecting and quantifying the number of trucks using imagery from the Copernicus Sentinel-2 mission.
In April, ESA launched a call for proposals as part of a special edition of the Custom Script Contest, an initiative run in coordination with the European Commission and managed by Euro Data Cube. Building on the power of public engagement, the contest aimed to explore how the resources provided by Euro Data Cube can be used in conjunction with high-quality Copernicus satellite data to monitor coronavirus and its impacts.
The weekly winners of the contest were invited by ESA to upscale their ideas to cover representative areas of the EU that could provide policy-relevant insights. From these upscaled submissions, two overall winners were selected and are now being integrated into the "Rapid Action on COVID-19 with Earth Observation" dashboard.
This platform, developed in beta version in just two months, showcases how Earth Observation satellite data can contribute to measuring some of the impacts of coronavirus lockdown on the economy, agriculture, and the environment, and can help monitor post-lockdown recovery (considering parameters such as air and water quality, economic activity such as industrial production, shipping, traffic on air or land, and agricultural productivity).
Today, ESA is releasing the first community-contributed indicator to the public—one of the winners of the COVID-19 Custom Script Contest. The solution, titled "Truck Detection—Sensing Trade from Space" was developed by Henrik Fisser (Julius-Maximilians-University Würzburg, Germany) and uses imagery from the Copernicus Sentinel-2 mission to detect and quantify the number of moving trucks along roads across the EU.

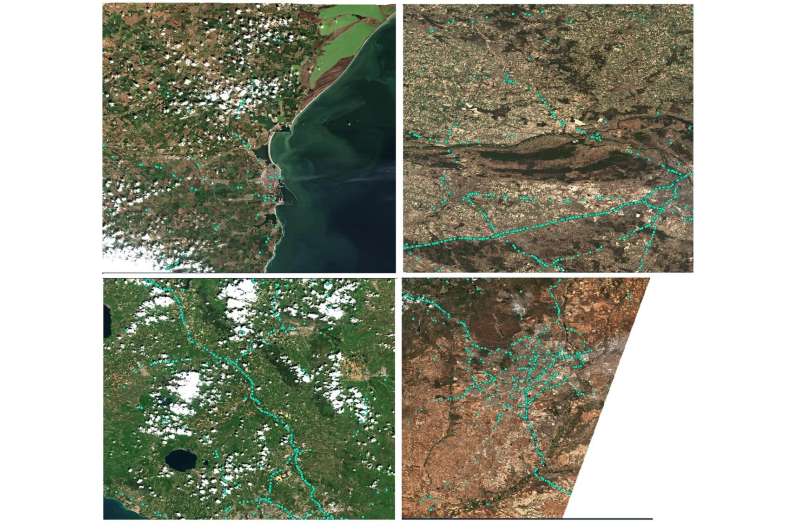
The results show that truck traffic in the EU has decreased by an average of 11% (15% on motorways, and 7% on other roads) compared to median truck counts for the years 2017–2019, and by a significant 42% on the French and Belgian parts of the European route "E 40." To achieve these results, Henrik processed and analyzed vast amounts of Copernicus Sentinel-2 data in the Euro Data Cube platform, covering the entire EU from 2017–2020 at a resolution of 10 meters per pixel.
"Hendrik's solution is very elegant and innovative, as trucks are not usually visible in Sentinel-2 imagery," says Patrick Griffiths, EO Data Engineer coordinating the upscaling effort. "At the same time, the detection principle is simple and scalable. As the logistics sector was heavily impacted by the pandemic, Henrik's results are potentially highly relevant for policy and related impact assessment."
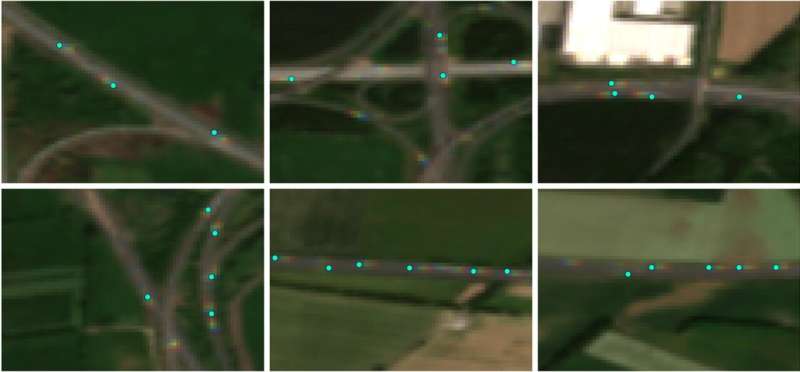
In his innovative proposal, Henrik developed a detection method using the reflectance patterns of long moving vehicles such as trucks. While individual trucks are too small to show up as objects in the images, their motion leaves behind a telltale "rainbow reflectance track" that marks their presence. This enables vehicle mapping to reveal how truck traffic—an indicator of the activity of economic operators across the world—has been affected by COVID-19. Hendrik validated his approach, amongst others, with ground-based motorway traffic count data from Germany.
"This indicator complements other economic indicators such as throughput of ships and airplanes in ports and airports, by providing a view of the logistics on land," adds Anca Anghelea, EO Open Data Scientist and product lead for the dashboard. "It also comes with new features and interactions that are being added to the dashboard, such as on-demand indicator computation based on user-defined areas of interest."
More information: The truck traffic indicator is now available on the Rapid Action on COVID-19 with Earth Observation dashboard.
Provided by European Space Agency


