NASA analyzes Hurricane Pali's rainfall rates

Tropical storm Pali intensified late on Jan. 11 to become the earliest hurricane ever recorded in the Central Pacific Ocean. Warm ocean waters from El Nino supplied the extra energy needed for Pali to develop and prosper so early in the year. NASA's GPM core observatory got an inside look at the record-breaking hurricane while the Suomi NPP satellite captured a visible-light look at the storm from above.
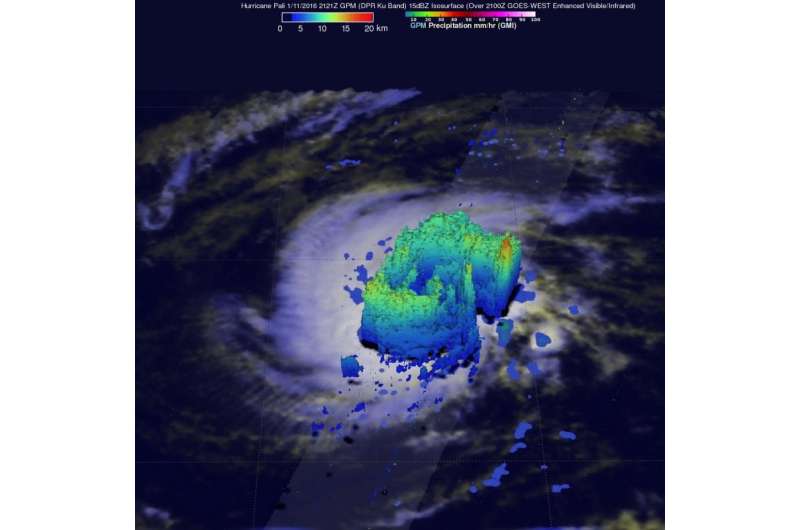
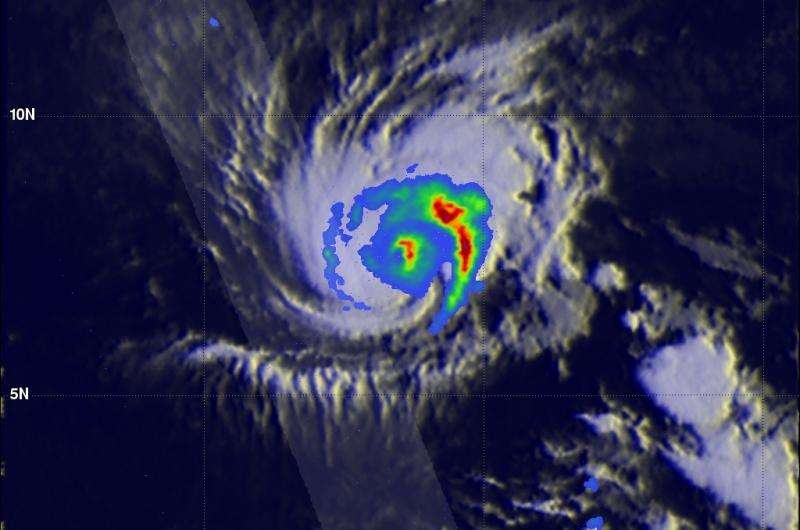
The GPM core observatory satellite flew over Pali on January 11 at 2121 UTC (4:21 p.m. EST). GPM's Dual-Frequency Precipitation Radar (DPR) data sliced through Pali clearly showing that an eye had formed. GPM's DPR measured rain falling at a rate of 84.5 mm (3.3 inches) per hour on the eastern side of Pali's forming eye. On Jan. 12, GPM saw heaviest rainfall occurring on in the eastern eyewall and in a band of thunderstorms in the eastern quadrant at 50 mm (~2 inches) per hour.
GPM's radar (DPR Ku Band) peered through Pali's clouds and discovered that powerful convective storms south of the eye were reaching heights of about 12.5 km (7.8 miles). GPM measured the tallest storm top heights of 16.6 km (10.3 miles) in a strong feeder band wrapping around Pali's eastern side.
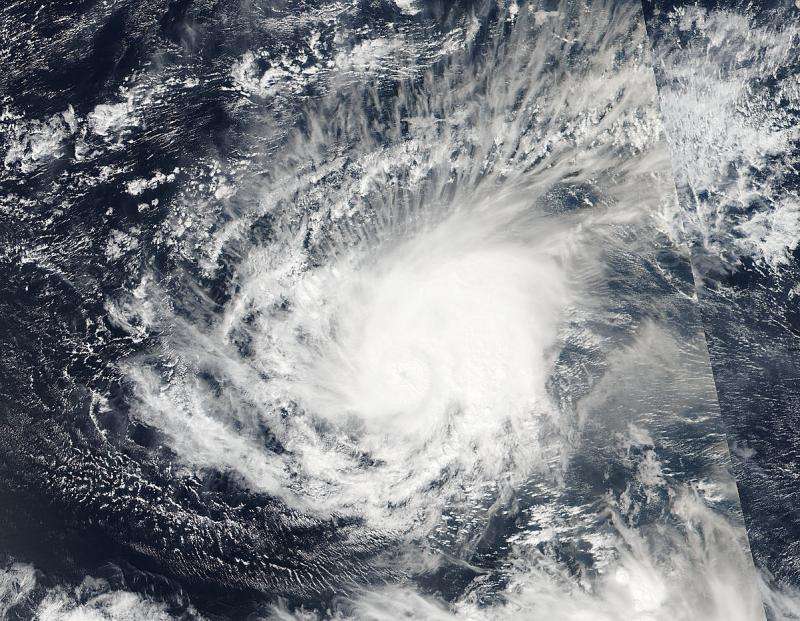
On Jan. 13, at 01:15 UTC (Jan. 12 at 9:15 p.m. EST) the Visible Infrared Imaging Radiometer Suite (VIIRS) instrument aboard NASA-NOAA's Suomi NPP satellite captured a visible light image of Hurricane Pali in the central Pacific Ocean. The image showed that the eye had become cloud-filled and bands of thunderstorms continued to circle the center of the storm. VIIRS collects visible and infrared imagery and global observations of land, atmosphere, cryosphere and oceans.

On Jan. 13 at 10 a.m. EST (5 a.m. HST/1500 UTC) NOAA's Central Pacific Hurricane Center (CPHC) reported the center of Hurricane Pali was located near latitude 4.2 north and longitude 171.8 west. That's about 875 miles (1,410 km) south of Johnston Island and 1,505 miles (2,420 km) southwest of Honolulu, Hawaii. Maximum sustained winds are near 80 mph (130 kph) and weakening is forecast over the next couple of days. Pali's hurricane force winds were concentrated and extended outward up to 10 miles (20 km) from the center. Tropical storm force winds extend outward up to 105 miles (165 km).
Pali was moving toward the south-southwest near 8 mph (13 kph) and a turn toward the southwest later today will be followed by a turn toward the west by Friday, Jan. 15. For updated forecasts, visit NOAA's CPHC: http://www.prh.noaa.gov/hnl/cphc/.

Provided by NASA's Goddard Space Flight Center


