How big data can be used to understand major events
With the most unpredictable UK general election looming in modern times, how can big data be used to understand how elections are covered by the media? New research has for the first time analysed over 130,000 online news articles to find out how the 2012 US presidential election played out in the media.
Academics from the University of Bristol's Intelligent Systems Laboratory (ISL), led by Nello Cristianni, Professor of Artificial Intelligence, analysed mass media coverage from the 2012 US presidential election using big data. The paper is published in the journal Big Data and Society.
This is the first study in which political positions have been automatically obtained from a very large amount of online news. The system created goes well beyond traditional word-association networks with the use of richer linguistic analysis of texts.
By analysing the individual campaigns of the main presidential candidates, Obama and Romney, the research team studied how each campaign was represented in the media and found one of the key issues covered by the media during the 2012 campaign was Obama's defence of his record on economic policy.
The findings suggest the issues of the Democratic Party the media focused on were the US economy and civil rights. Overall, media reporting contained more frequent positive statements about the Democrats than the Republicans. The Republicans were also more often the focus of negative statements by Democrats and other players.
The study found the Republicans had more divisive opinions on issues compared to the Democrats. The most contentious subjects in the campaign were the economic split between the two camps of tax breaks and the economy, and the split over gay marriage.
Saatviga Sudhahar, Research Assistant in Machine Learning in the ISL and Department of Computer Science, and the main researcher on the project, said: "Mapping the full electoral campaign coverage by offline and online media is a very difficult challenge, given the large amount of data and the large number of sources available in advanced democracies.
"We believe that the methodology used for the study is a big step forward in the linguistic analysis of texts by using extracted relational data and could help us understand major events."
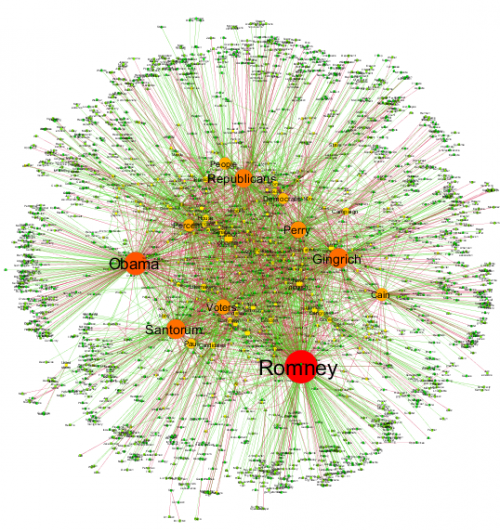
The research team used a semantic graph that analysed the text and linked it to identified noun phrases and verbs. The subject-verb-object triplets were then used as building blocks for a network. This method has never been applied to a real-world dataset on this scale and millions of documents were analysed to complete the study.
By using media data and having relationships in a graph, the researchers uncovered a unique mixture of endorsements and disapproval to represent the Republican and Democratic camps.
The research team found that the range of political positions can be reliably recovered from the set of claims attributed to each actor by the media reporting. The split of the network into the two main camps provides strong evidence that the main political relations can be found by using this approach.
More information: 'Automated analysis of the US presidential elections using big data and network analysis' by Sudhahar S, Veltri GA and Cristianini N in Big Data and Society.
Further information about the study, together with together with high-res images, is available at mediapatterns.enm.bris.ac.uk/USElections
Provided by University of Bristol


