April 24, 2014 report
Physicists use magnetism simulation software to model US presidential elections

(Phys.org) —A team of physicists working at IFISC in Palma de Mallorca, Spain has used a computer simulation originally designed to model the transition of iron between magnetized states to create a model to do something similar for voting patterns in the United States. In their paper published in Physical Review Letters, the team describes how they used factors of influence by interactions between voters to create a model that accurately predicted how influenced voters would vote.
Creating a computer model that can accurately predict the outcome (the winner and loser) of an election is still just a pipe dream, of course. What is possible though is modeling human behavior as it relates to voter patterns. One such behavior is the tendency of voters to be impacted by the opinions of others, whether those of people that live near them, or those that commute to places where they work. It's this tendency that the team in Spain has tried to model.
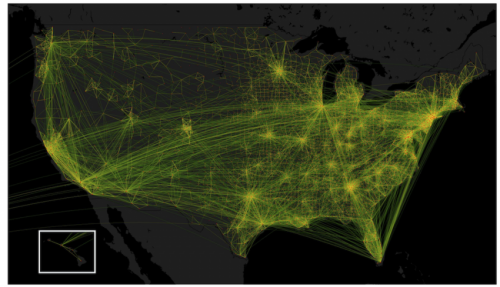
To model voter tendencies on a computer the researchers narrowed down the factors of influence that lead to voting tendencies to just two: the proportion of Republicans versus Democrats in a given voter's home county and the proportion of Republicans versus Democrats where they work. This (and probability and statistics) allowed for modeling the impact of influence in a variety of situations. One example would be where a voter is Democrat but lives or works among Republicans, a situation that can in many cases cause them to vote Republican. The model allowed for increasing or decreasing the distance between such voters to allow for an increase or dissipation of influence impacting possible voting trends.
Instead of trying to predict who would win a given election, the model alternatively shows trends by focusing on margin of victory—by noting voter trends across varying regions—with visual representations of changes in voting behavior as distance between impact factors change. To find out if their model was accurate, the team input census data from the nine presidential elections covering the years 1980 to 2012. Doing so revealed previously unknown correlations between regions that actually existed in the real world of vote casting and graphically illustrated the influence that voters have on one another. One striking example was the county to county variability displayed, indicating the percentage of votes going to either party—showing that the national mean changes from election to election, but not the degree of fluctuation between counties.
More information: Is the Voter Model a Model for Voters? Phys. Rev. Lett. 112, 158701 – Published 18 April 2014. journals.aps.org/prl/abstract/ … ysRevLett.112.158701
ABSTRACT
The voter model has been studied extensively as a paradigmatic opinion dynamics model. However, its ability to model real opinion dynamics has not been addressed. We introduce a noisy voter model (accounting for social influence) with recurrent mobility of agents (as a proxy for social context), where the spatial and population diversity are taken as inputs to the model. We show that the dynamics can be described as a noisy diffusive process that contains the proper anisotropic coupling topology given by population and mobility heterogeneity. The model captures statistical features of U.S. presidential elections as the stationary vote-share fluctuations across counties and the long-range spatial correlations that decay logarithmically with the distance. Furthermore, it recovers the behavior of these properties when the geographical space is coarse grained at different scales—from the county level through congressional districts, and up to states. Finally, we analyze the role of the mobility range and the randomness in decision making, which are consistent with the empirical observations.
Journal information: Physical Review Letters
© 2014 Phys.org


