SMOS sees triple superstorms

ESA's versatile water mission tracked Asia's recent storms over land and sea.
Over the past three weeks, tropical cyclone activity has intensified over the seas bordering southern and eastern Asia.
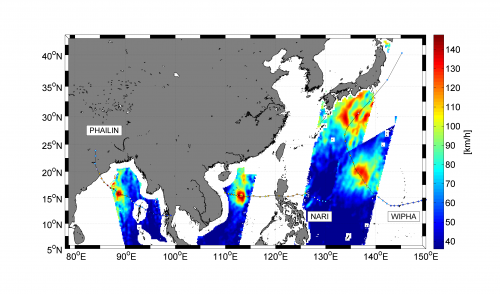
Cyclone Phailin began forming on 4 October in the Gulf of Thailand, before moving northwest across the Bay of Bengal and making landfall in northern India. The storm affected about 12 million people and claimed dozens of lives.
Typhoons Nari and Wipha subsequently formed on 8 October: Nari west of the Philippines and Wipha east of Guam. Nari displaced tens of thousands of people in the Philippines and Vietnam, while Wipha lashed Japan's east coast.
During all three superstorms, ESA's Soil Moisture and Ocean Salinity satellite, SMOS, captured snapshots of surface wind speeds under the intense storms.
SMOS carries a novel microwave sensor to capture images of 'brightness temperature'. These images correspond to radiation emitted from Earth's surface, which are then used to derive information on soil moisture and ocean salinity.

Strong winds over oceans whip up waves and whitecaps, which in turn affect the microwave radiation from the surface. This means that although strong storms make it difficult to measure salinity, the changes in radiation can, however, be linked directly to the strength of the wind over the sea.
This method of measuring wind speeds, thanks to the fact that SMOS is largely unaffected by atmospheric conditions such as thick clouds or rain, was developed by scientists at France's Ifremer and CLS research centres. It was first used when Hurricane Igor developed over the Atlantic Ocean in 2010.
Being able to measure ocean surface wind in stormy conditions with the broad and frequent coverage that SMOS can provide is paramount for tracking and forecasting storm strength.
"The information that SMOS can provide for storm forecasting has great potential for future operational use of such data. Now that the method has been more consolidated, we are planning to deliver data to the community on a regular basis," says Nicolas Reul from Ifremer.
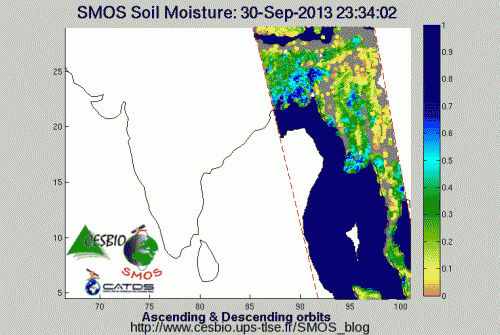
In addition to tracking this month's storms at sea, SMOS also gathered readings of soil moisture when the storms hit land. The data show which areas experienced the most extreme flooding caused by heaving rainfall and overflowing rivers. This information could be valuable for early warnings and hydrological forecasting.
Launched in 2009, the versatile SMOS satellite has gone above and beyond its original objectives of mapping soil moisture and ocean salinity. In addition to tracking major storms, its measurements are also providing new information on sea-ice, permafrost and wetlands.
Provided by European Space Agency


