New open-source online maps provide details of urban supply chains

As ever-larger "megacities" become home to more and more of the world's people, the supply chains that bring essential supplies to these crowded populations will become increasingly complex.
To help manage these logistics, researchers at MIT's Megacities Logistics Lab have gathered data—collected by 11 MIT students paired with local students around the world—on representative neighborhoods in Mexico City, Rio de Janeiro, Beijing, Santiago, Sao Paulo, Kuala Lumpur and Madrid.
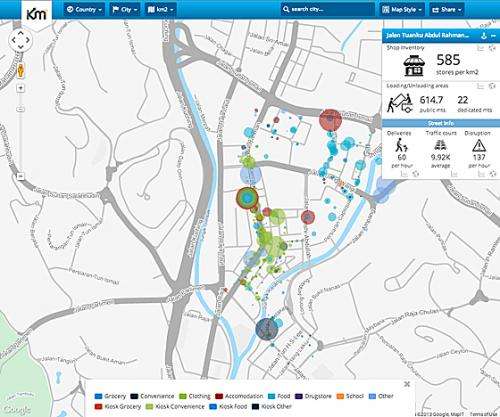
Now that data has been made available online, at no cost, in an open-access pool of information that's graphically represented on city maps.
Edgar Blanco, research director at MIT's Center for Transportation and Logistics and the initiator of the project, explains that it arose from the realization that "some of the things we take for granted don't exist" in many rapidly growing cities in the developing world. A better understanding of the supply chains needed to support those burgeoning populations was also essential, he says, for both business and regulatory planning.
"All the models we have tried using for logistics [based on experience in the industrialized world] were not applicable," Blanco adds. "We need to learn more about the logistics in megacities, mostly because they represent the future of urbanization."
Part of the project involved developing a web platform to collect, organize and display the data in real time. As they stood on sidewalks recording each delivery truck, cart or bicycle making deliveries in a one-square-kilometer area of the city, the students could upload the data remotely, posting on the maps instantly.

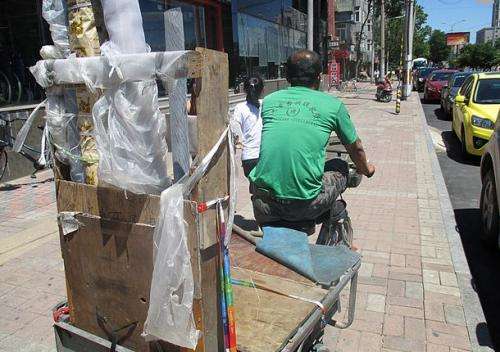
They documented not only how many and what kinds of vehicles were used to make deliveries, but also where they parked and how much traffic disruption they caused. All of this data could be useful for those planning roadways, parking areas and bike lanes.
In many developing nations, urban centers are increasingly central to economic activity, attracting population from the surrounding towns and villages. But the infrastructure to support these growing populations often lags. "The cities themselves don't know much about the logistics either, about what the city needs from a goods point of view," Blanco says.
Planners tend to focus on essential needs such as plumbing and sewer systems, "but they don't think about how goods need to move to the cities," Blanco says. "Once they reach a certain size, there can be chaos."
"We not only have to design better logistics systems in the cities, we need cities that are designed better for logistics," he adds.

For example, the data gathered by the MIT students this summer—and in the future, as the database grows—could help planners decide whether to ban (or encourage) certain vehicles from particular areas, or to allow large trucks only at certain times. Multiplied over a vast megacity, such decisions can have a big impact.
As the database grows, it will become easier for planners to find cities with comparable population density, businesses and transportation links, Blanco says. For example, Tokyo has a long history of dealing efficiently with high density and complex supply logistics, and might hold lessons for some cities with similar conditions. "Maybe what works in one area of Mumbai could also work in Mexico City," he says.
After the success of this summer's pilot project, Blanco says, he hopes to continue sending students to gather information for addition to the database. But the system is also open to input from anyone. "It's an open platform," he says. "Anyone in the world can access and contribute data."
As the information builds, supply chains might improve as businesses gain the ability to plan according to the real conditions in each city. For example, Blanco says, in North America only about 5 percent of the cost of goods is attributable to transportation costs, on average, but in Latin America that figure is as high as 25 percent. Improving the efficiency of supply chains could cut the cost of consumer goods, improving the standard of living.
Provided by Massachusetts Institute of Technology
This story is republished courtesy of Planet Earth online, a free, companion website to the award-winning magazine Planet Earth published and funded by the Natural Environment Research Council (NERC).


