Research reveals new data-driven methods for understanding climate change

(PhysOrg.com) -- In February 2012, the journal Nature Climate Change will publish a paper on rainfall extremes in India by principal investigator Vipin Kumar of the University of Minnesota's computer science and engineering department and co-principal investigator Auroop Ganguly of the civil and environmental engineering department at Northeastern University in Boston, members of the National Science Foundation's (NSF) Expeditions project team. Nature pre-published the paper online today.
Using statistical analysis methods to examine rainfall extremes in India, a team of researchers has made a discovery that resolves an ongoing debate in published findings and offers new insights.
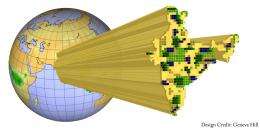
The study, initiated by Auroop Ganguly and colleagues at Oak Ridge National Laboratory, reports no evidence for uniformly increasing trends in rainfall extremes averaged over the entire Indian region. It does, however, find a steady and significant increase in the spatial variability of rainfall extremes over the region.
These findings, published in Nature Climate Change, are contrary to results of some earlier work on this subject. The new study uses statistical methods designed explicitly for modeling extreme values and associated uncertainties.
"Our research suggests that one needs to be aware of the different characterizations of extremes and that these characterizations require both interpretability and statistical rigor," said Ganguly, now a faculty member at Northeastern University in Boston.
In addition, it makes sense to look at local and regional drivers such as urbanization and deforestation in addition to global scale issues. Although this study focused on rainfall variability in India, the same methodology can be applied to any region of the world, Ganguly said.
Ganguly and co-authors Subimal Ghosh (Indian Institute of Technology Bombay, Debasish Das (Temple University) and Shih-Chieh Kao (ORNL) used their statistical methodologies to analyze data from 1,803 stations from 1951 to 2003. This information was provided in 1-by-1-degree spatial grids by the India Meteorological Department.
The research team noted that statistical observations offer complementary insights compared to the current generation of physics-based computational models. This is especially the case if the goal is to understand climate and rainfall variability at local to regional scales.
Understanding climate model-simulated trends of precipitation extremes and developing metrics relevant for water resources decisions were the focus of a paper published earlier this year in the Journal of Geophysical Research. In that paper, Ganguly and co-author Kao showed that while models provide relatively credible predictive insights of precipitation extremes at aggregate spatial scales, the uncertainty begins to increase significantly at localized spatial scales – especially over the tropical regions.
"Even as higher resolution models are attempting to get to the stage where spatially explicit insights can be generated, the kind of insights generated from observations in this study can be used as methods for model diagnostics and can help address science gaps," Kao said.
Ganguly noted that the Nature Climate Change paper, titled "Lack of uniform trends but increasing spatial variability in observed Indian rainfall extremes," is the result of a team effort with researchers from diverse disciplines. Ghosh, the first author, is a hydro-climate scientist and civil engineer; Das is a graduate student in computer science and data mining; Kao is a statistical who specializes in water availability and flood frequency analysis; and Ganguly, a civil engineer, specializes in climate extremes and water sustainability as well as data sciences for complex systems.
Journal information: Nature Climate Change
Provided by National Science Foundation


.jpg)


