NASA maps Typhoon Matmo's Taiwan deluge

When Typhoon Matmo crossed over the island nation of Taiwan it left tremendous amounts of rainfall in its wake. NASA used data from the TRMM satellite to calculate just how much rain fell over the nation.
The Tropical Rainfall Measuring Mission or TRMM satellite orbits the Earth and provides coverage over the tropics. TRMM is a satellite that is managed by both NASA and the Japan Aerospace Exploration Agency (JAXA) that acts as a "flying rain gauge in space," that can estimate how fast rain is falling within storms on Earth and how much rain has fallen.
On July 22, at 1500 UTC (11 a.m. EDT), the Joint Typhoon Warning Center noted that Matmo was making landfall on Taiwan's east coast. At the time of landfall, Matmo's maximum sustained winds were near 85 knots (97.8 mph/157.4 kph). In addition to damaging winds Matmo produced very heavy rainfall while passing over central Taiwan.
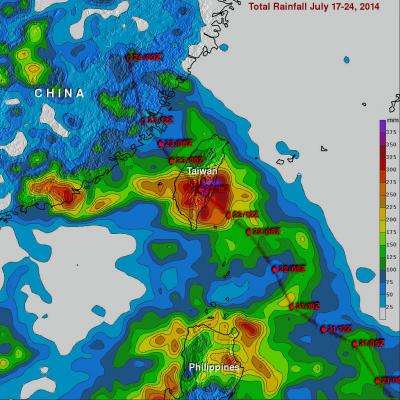
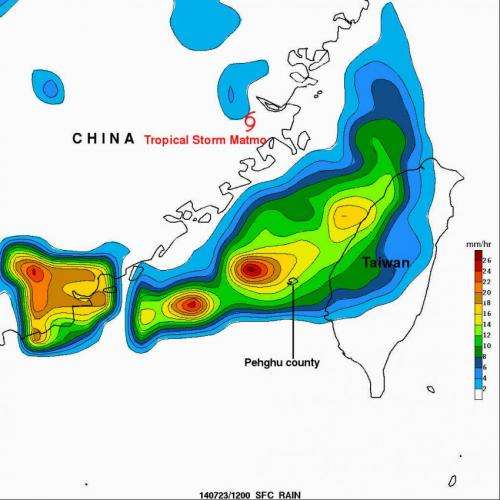
TRMM gathered rainfall data from Matmo and at NASA's Goddard Space Flight Center in Greenbelt, Maryland, that data was used in a TRMM-based, near-real time Multi-satellite Precipitation Analysis (TMPA) to show rainfall totals for the period from July 17-24, 2014. The TMPA showed that rainfall totals greater than 400 mm (about 15.7 inches) soaked eastern Taiwan. Heavy rainfall also occurred on July 23 over the Taiwan Strait. That band of heavy rainfall associated with Typhoon Matmo may have contributed to a deadly airplane crash in the Penghu Islands.

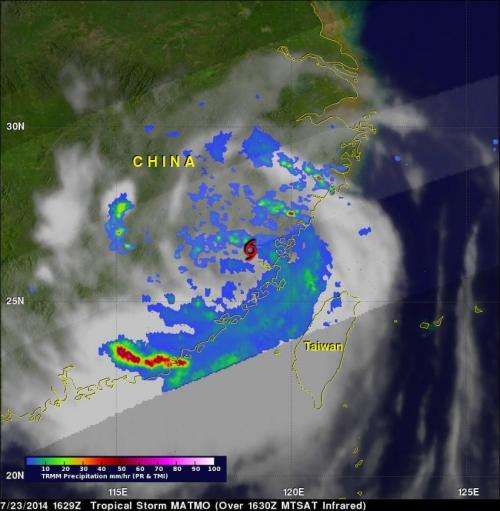
Weakening tropical storm Matmo with wind speeds of less than 50 knots (about 58 mph) was moving northwestward over China when the TRMM satellite flew overhead on July 24, 2014 at 1629 UTC (12:29 p.m. EDT). TRMM's Microwave Imager (TMI) data observed that the heaviest precipitation was falling at a rate of over 75 mm (almost 3 inches) per hour in a rain band traveling around the southern side of Matmo's circulation.

Taiwan's Central Weather Bureau reported that the eastern coastal counties of Taitung and Hualien received as much as 600 millimeters of rain in the mountainous areas,
Provided by NASA's Goddard Space Flight Center


