TRMM satellite measures up Super Typhoon Rammasun

NASA's TRMM satellite measured up Super Typhoon Rammasun's rainfall rates, rainfall totals and cloud heights providing a look at the inner workings and aftermath of the storm.
Super Typhoon Rammasun struck the southern coast of China on Friday, July 18 as a very powerful super typhoon with sustained winds estimated at 135 knots (~155 mph or equivalent to a Category 5 hurricane on the US Saffir-Simpson scale), making it the strongest typhoon to hit the area in several decades.
Rammasun made landfall at 3:30 p.m. (local time) on Hainan Island where the southern half of the intense eye wall raked across the northeast tip of that island. The center then quickly cut across the Qiongzhou Strait separating Hainan from the Leizhou Peninsula to the north. The right half of the storm then impacted the southern part of Leizhou Peninsula, which is located in the southwest corner of Guangdong province. Rammasun re-emerged over the Gulf of Tonkin slightly weaker before making its final landfall in China on the coast of Guangxi province near the border with Vietnam.
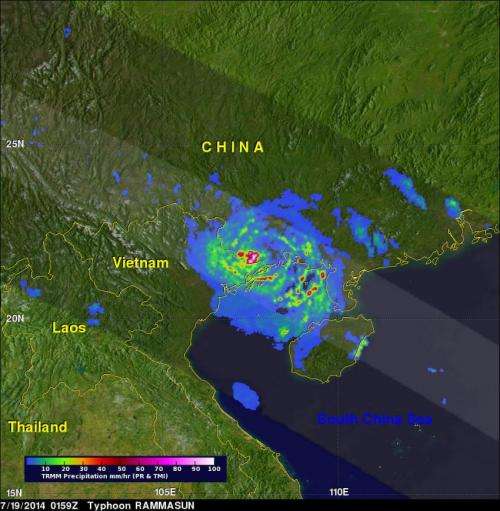
The Tropical Rainfall Measuring Mission or TRMM satellite, which has been collecting data and recording images of tropical cyclones over the global tropics for an astounding 17 years now, captured this first image of Rammasun, which is Siamese for 'thunder god,' just after it had made its final landfall on the coast of mainland China near Vietnam.

At 01:59 UTC (8:59 a.m. local time) on July 19, TRMM captured an image of the horizontal distribution of rainfall throughout Rammasun. Rain rates in the center of the satellite's path were gathered from the TRMM Precipitation Radar (PR) instrument while those in the outer swath were measured by the TRMM Microwave Imager (TMI). TRMM showed extremely heavy rain rates (near the storm's center) on the order of 100 mm (~4 inches) per hour along the China/Vietnam border. Strong rain bands (indicating moderate and heavy areas of rain respectively) wrapped around the storm, indicating the storm maintained a powerful cyclonic circulation.
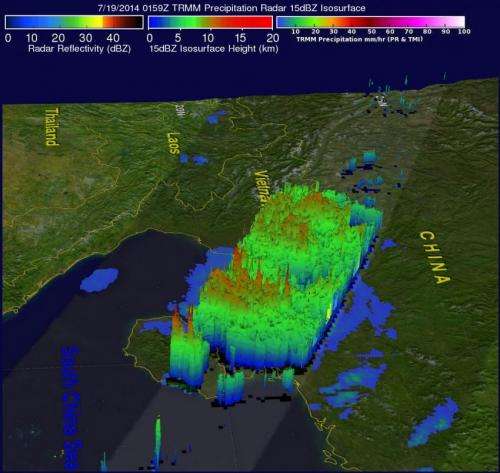
At NASA's Goddard Space Flight Center in Greenbelt, Maryland, visualizers took the TRMM satellite data and created a 3-D view of Rammasun looking west. The 3-D image showed the highest, more intense thunderstorms within Rammasun. There were some thunderstorms that reached as high as 9.3 miles (15 kilometers) and many surrounded the eyewall.
In addition to creating the horizontal and 3-D image of tropical cyclones at NASA Goddard, TRMM data is used in an analysis with other satellites to create an overall look at rainfall coverage.

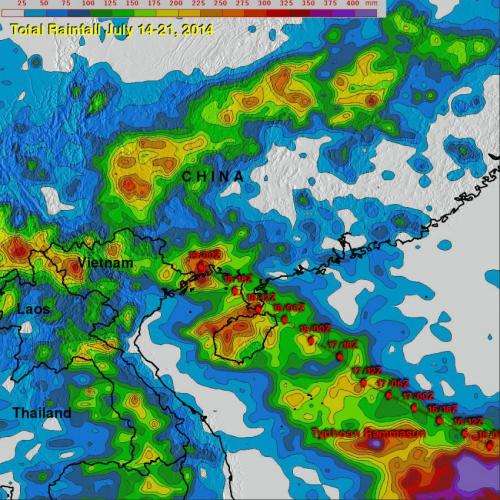
The TRMM-based, near-real time Multi-satellite Precipitation data (TMPA) analysis uses TRMM to calibrate rainfall estimates from other satellites to expand the rainfall coverage of the TRMM satellite. TMPA rainfall estimates for the period from July 14 to 21, 2014 showed a swath of heavy rain associated with the passage from extending from just west of the Philippines across the South China Sea and into southern China. Rainfall totals on the order of 225mm (~9 inches) or more covered much of Hainan Island and the southern Leizhou Peninsula with upwards of 325 mm (~13 inches) over the south China coast adjacent to Vietnam where Rammasun made its final landfall.
Provided by NASA's Goddard Space Flight Center


