Astronomers map icy wastes in space
Astronomers map icy wastes in space
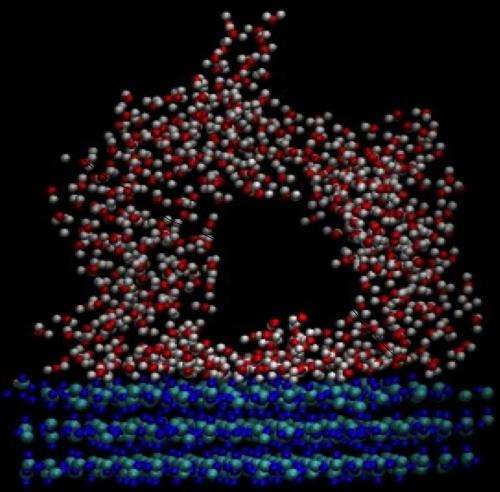
In space, ice forms by building up a ‘frost-like’ layer on dust grains at a temperature of -263 degrees Celsius. The layer that results is a bit like the frost that forms on a car windscreen on a (somewhat less) cold morning on Earth. In this image the dust layer is represented by the blue coloured molecules at the bottom of the image. Water molecules have two hydrogen atoms (shown here in white) and one oxygen atom (shown here in red). Here the ice forms without structure (so-called amorphous ice), quite unlike the more familiar cubes of ice that you might find in a drink. This results in pores forming in the ice - the big 'hole' in the middle of this simulation. The 'hole' here is nano-sized - about a million times smaller in diameter than the diameter of a human hair. Gases get trapped in these pores, which can have a profound effect on temperatures and densities in regions of star formation. Credit: Helen Fraser / Open University

(Phys.org) —Using the AKARI orbiting observatory, astronomers from the Open University have made the first large-scale maps of icy material where stars are forming. In a challenge to conventional ideas about the formation of water in space, they find ice in regions with little dust or gas. Dr Helen Fraser, who led the new work, presented the results in her talk at the National Astronomy Meeting in Portsmouth this week.

Launched by the Japanese space agency JAXA in 2006, AKARI (meaning 'light' in Japanese) surveyed 90% of the sky at infrared wavelengths until it ceased operations in 2011. The OU team used data from the to make maps of the icy material in 28 star-forming regions, covering sections of the sky 10 arc minutes by 10 arc minutes (1 arc minute is 1/60th of a degree).

In the regions covered in the survey, temperatures are very cold (-263 degrees Celsius and 10 degrees above absolute zero) and pressures are low, with only a few hundreds to a few thousands of molecules in each cubic centimetre of space. Under these conditions, of gas collide with the dust that is found there and form layers of 'frost' on the dust surfaces. These nano-scale icy dust grains are the chemical factories of star-formation, where successively more complex chemistry occurs. This in turn seeds the pre-biotic organic molecules that search for in the 'habitable zones' (where temperatures are right for water to be a liquid) around newly forming stars that may be inextricably linked to the origins of life.

The new AKARI maps are the first of their kind and in contrast to the prevailing model, suggest that ice is found in regions without much dust or gas. If ice can even form in these zones, it can quickly suck up or 'sorb' nearby gases, in the process changing local conditions, for example the amount of material available to form new stars and planets.

Dr Fraser sees this as a surprising discovery and one that could change our model for the formation of stars and planets.
Astronomers map icy wastes in space
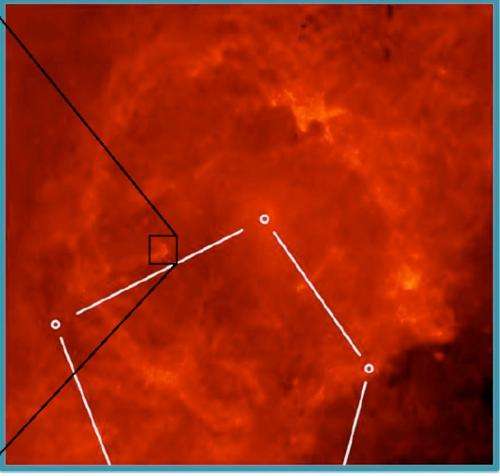
This hot ‘O’-type star is losing copious amounts of material in a ‘stellar wind’ and carving out a void in the cloud. The black box marks the region B35a, a star-forming region blown into a point by the wind, where Dr Fraser searched for icy material. Credit: IRAS

She comments: "Until this research we never previously had a view of the cold solid-state universe, the icy freezers from which stars and planets ultimately form. Given that the results in our own local galaxy are so surprising, the question remains what other galaxies look like when we map their ice features."
Astronomers map icy wastes in space
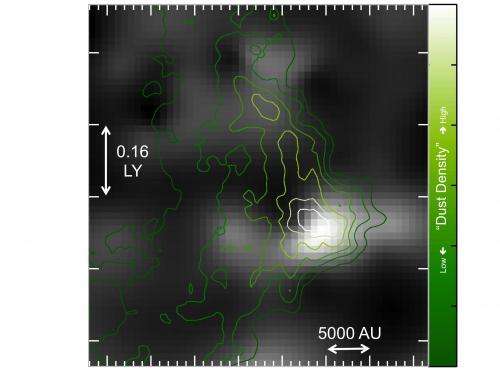
Brighter regions have the highest concentrations of water ice and black regions the lowest. The ‘contours’ indicate where the concentration of dust peaks (derived from JCMT HARP B and IRAM HERA observations of emitting interstellar gas). Distances are indicated in light years (LY – 1 light year is roughly 10 million million km) and astronomical units (AU – the mean distance from the Earth to the Sun of about 150 million km). Credit: Helen Fraser / Open University

Telescopes due to start operations in the 2020s, the James Webb Space Telescope and the European Extremely Large Telescope, will help researchers answer that question.
Astronomers map icy wastes in space
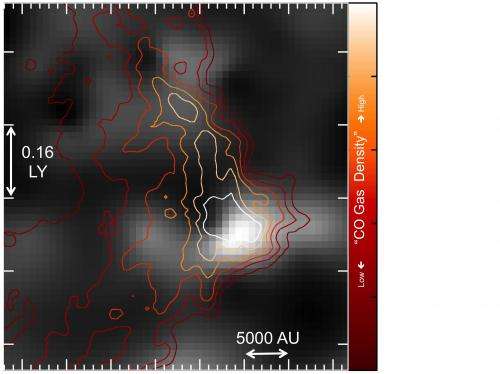
The map is constructed from observations with JCMT HARP B and IRAM HERA observations (gas) and the AKARI satellite Infrared Camera (IRC) Near-Infrared Prism Spectroscopy mode (NP) (dust). Here the lightest regions correspond to the highest concentrations of ice and the darkest to where no ice is present. The overlaid contours show CO, where yellow / white lines mark where the most gas is found and redder lines mark where somewhat less CO is present. Where there are no lines no CO was found at all. The edge of B35a is the red line running from top to bottom on the right hand side of the image. The image shows that sometimes ice is observed where there is little gas and dust, challenging our understanding of chemical evolution of star forming regions. Credit: Helen Fraser  / Open University

Dr Fraser continues: "The coming decade could be astounding. We could be able to apply the same technique to nearby galaxies and see if the nano-fabrication factories that make organic matter work in the same way across the different epochs of the history of the cosmos."

More information: www.ras.org.uk/nam2014

Citation: Astronomers map icy wastes in space (2014, June 25) retrieved 9 May 2024 from https://phys.org/news/2014-06-astronomers-icy-space.html
This document is subject to copyright. Apart from any fair dealing for the purpose of private study or research, no part may be reproduced without the written permission. The content is provided for information purposes only.

Explore further

For galaxies, having neighbors matters

0 shares

Feedback to editors