Scientists use satellite and ground-based data to paint a picture of Amazonian weather patterns

What is a "normal" weather pattern in the Amazon and how does it vary from year-to-year? What does the weather look like without human interference?
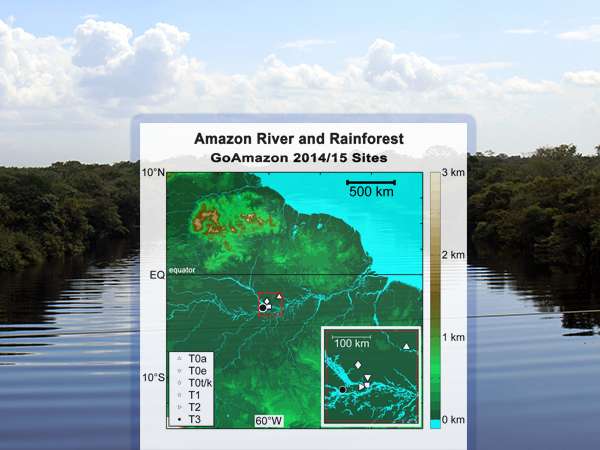
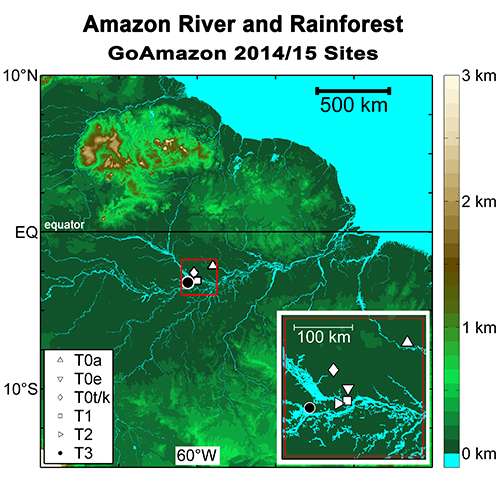
Researchers at Pacific Northwest National Laboratory, and their co-investigators at the Brazil National Institute for Space Research and Harvard University, investigated these questions at targeted sites in the Amazon rainforest near a major city. The sites were part of the GoAmazon2014/5 research study, which examined clouds and precipitation both up- and downwind of Manaus, Brazil, an industrial city surrounded by otherwise pristine rainforest.
The team showed that natural phenomena like river breezes drive large pattern variations in space and time across the study area. They also found that the study's timespan captured typical weather and could be used to represent average weather patterns.
Rainforests are often described as the lungs of the planet, producing up to 30 percent of the world's oxygen. As the largest rainforest in the world, the Amazon produces two-thirds of that oxygen, but is undergoing rapid change from human activities like deforestation and pollution. Investigating and recording the normal fluctuations of the Amazon's weather can help researchers understand how humans may be changing it.
The Green Ocean Amazon, or GoAmazon2014/5, field campaign was designed to measure and understand how the city of Manaus influences the clouds and precipitation forming around it, in areas of the rainforest, largely unaffected by human societal influences. The campaign meticulously collected data from airborne instruments and ground sites. Despite the careful data collection during the campaign, there was a limit to the number of sites that could be sampled and the length of time spent collecting. A key challenge was to determine whether the differences seen at the ground sites were from natural or human factors, and if the two-year sampling period represented normal conditions.

The team's analysis, which appeared in the Journal of Applied Meteorological Climatology, is based on 15-year composites of infrared (IR) satellite data. The underlying dataset consists of an IR brightness temperature, which is proportional to the actual temperature of the cloud or land. The dataset, collected from 2000 to 2014, has a fairly detailed resolution: a native temporal resolution of 30 minutes and a spatial resolution of 4 km x 4 km. To find thunderstorms, or deep convective clouds, the researchers looked for very cold cloud tops generated by churning circulation, or deep convection.
After identifying the deep convective systems, the researchers counted their frequency to understand how often storms occurred in each location for a given season, hour of day, month, etc. Satellite data was useful because it allowed the scientists to observe all locations in the Amazon with the same instrument, and to compare and contrast the frequency of storms at the different GoAmazon2014/5 sites. Understanding the naturally occurring background weather pattern variability is an important step for measuring the human-caused impact of the city of Manaus air emissions on clouds and precipitation forming in an otherwise untouched natural environment.
This research highlighted potential challenges for using the GoAmazon2014/5 datasets and laid the groundwork for other researchers to use the data to further understand atmospheric processes and human influences in the Amazon.
More information: Casey D. Burleyson et al. Spatial Variability of the Background Diurnal Cycle of Deep Convection around the GoAmazon2014/5 Field Campaign Sites, Journal of Applied Meteorology and Climatology (2016). DOI: 10.1175/JAMC-D-15-0229.1
Provided by Pacific Northwest National Laboratory


