February 18, 2016 report
Long term satellite data offers insights into degree of global sensitivity to climate change

(Phys.org)—A team of researchers from several institutions in Norway and the U.K. has isolated the parts of our planet that appear to be the most sensitive to climate change using several years of satellite data. In their paper published in the journal Nature, the team describes their use of data covering the past 14 years and what their study revealed. Alfredo Huete with University of Technology Sydney offers a News & Views piece on the work done by the team and outlines the importance of such studies.
Most climate scientists know that as the planet warms, some parts of it will change more than others—some will become drier, some wetter, and some will change so much they will become entirely new ecosystems. They also know that some parts of the world are more sensitive to a warming planet than others—the upper altitudes of big mountain ranges, for example, or the Arctic tundra are likely to be more sensitive than large desert areas.
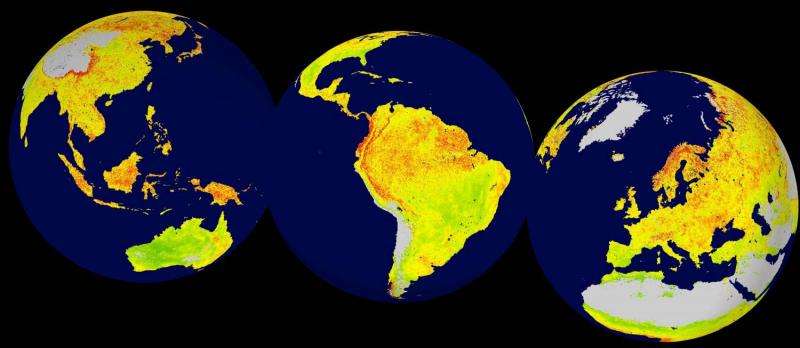
But, as Heute notes, what has been lacking is a way to define just how sensitive a place or ecosystem is, and then defining a means of applying an indicator of sorts to the various parts of the planet to allow for comparison. That is just what this new team has done, by poring over satellite data that revealed changes on the surface, such as more or less green, more or less rainfall, etc., they were able to chart which parts of the planet were showing how sensitive they were to the changes that have already occurred—they called their indicator 'the vegetation sensitivity index' and used it to create maps that showed the degree of sensitivity in various areas across the globe, which also of course, showed which parts are the most sensitive, e.g. parts of the boreal forest, alpine regions, prairies and steppe, the Arctic tundra, parts of central Asia and both North and South America; also the Caatinga and some of parts of Eastern Australia.
Identifying the degree of sensitivity of various parts of the planet, Huete notes, is necessary for making plans to avoid irreversible damage to vital ecosystems and hopefully sustaining those that are most critical to our own survival.
More information: Alistair W. R. Seddon et al. Sensitivity of global terrestrial ecosystems to climate variability, Nature (2016). DOI: 10.1038/nature16986
Abstract
The identification of properties that contribute to the persistence and resilience of ecosystems despite climate change constitutes a research priority of global relevance1. Here we present a novel, empirical approach to assess the relative sensitivity of ecosystems to climate variability, one property of resilience that builds on theoretical modelling work recognizing that systems closer to critical thresholds respond more sensitively to external perturbations2. We develop a new metric, the vegetation sensitivity index, that identifies areas sensitive to climate variability over the past 14 years. The metric uses time series data derived from the moderate-resolution imaging spectroradiometer (MODIS) enhanced vegetation index3, and three climatic variables that drive vegetation productivity4 (air temperature, water availability and cloud cover). Underlying the analysis is an autoregressive modelling approach used to identify climate drivers of vegetation productivity on monthly timescales, in addition to regions with memory effects and reduced response rates to external forcing5. We find ecologically sensitive regions with amplified responses to climate variability in the Arctic tundra, parts of the boreal forest belt, the tropical rainforest, alpine regions worldwide, steppe and prairie regions of central Asia and North and South America, the Caatinga deciduous forest in eastern South America, and eastern areas of Australia. Our study provides a quantitative methodology for assessing the relative response rate of ecosystems—be they natural or with a strong anthropogenic signature—to environmental variability, which is the first step towards addressing why some regions appear to be more sensitive than others, and what impact this has on the resilience of ecosystem service provision and human well-being.
Journal information: Nature
© 2016 Phys.org


